Although today's action did not eliminate the Counts I was following that had us in a 4th wave correction of some degree (Counts 2 and 5), the retracements were deep enough that I have now dropped those Counts. That leaves Counts 1 and 4 mapping the decline from 1131.23. Count 1 has us in a deep 2nd wave retracement of the 5 wave decline from 1131.23, while Count 4 puts us in a (1),(2),i,ii down from 1131.23 and so in a shallower 2nd wave retracement of the decline from 1082.60, the start of wave i.
The Options listed below are the different ways to count the move down from 1219.80. There are 5 that I'm following and they are set out on the 60 min counts page.
On the chart of each Option I have labelled one of the 2 remaining Counts for the decline from 1131.23. Each of these Counts could apply to any one of the Options, though what they mean may differ depending on which Option you are looking at.
Here's how things stand after today:
Option 1 - Wave (ii) of [iii] topped at 1131.23
9 min chart:

I've applied Count 1 to the chart of this Option. It assumes that we completed 5 waves down from 1131.23 at the low of 1010.91. From that low, I've labelled the double zig zag count that I was posting earlier (an up to date chart can be found at the end of this post).
It puts us in the [C] wave of the second zig zag from 1010.91. Its possible that today's high marks the end of the second zig zag, or that the late day rally is the end of it, with a truncated 5th wave within [C] (the Dow made a new high but SPX did not) or we may have one more high to go to complete wave [C].
We are right at the bottom of the gap I mentioned yesterday, which starts at 1071 and ends just above 1074. Its also a 50% retracement of the decline from 1131.23, so it wouldn't be surprising if we turn back down here given a complete, or nearly complete, wave count.
Option 2 - Wave [ii] topped at 1131.23
9 min chart:

I've applied Count 1 to the chart of this Option also, so the comments made in respect of Option 1 apply here too.

I've applied Count 1 to the chart of this Option also, so the comments made in respect of Option 1 apply here too.
Option 3 - Wave [iv] of an ending diagonal completed at 1131.23
10 min chart:

As posted earlier today, I've also applied Count 1 to the chart of this Option, giving us 5 waves down from 1131.23 to 1010.91.
Remember that for this Option to remain valid, we need to stay above 999.83 for the 5th wave of the leading diagonal and so far, we have.
So, the main labelling from the 1010.91 low is now the bullish possibility that those 5 waves down complete wave [v] of a leading diagonal down from 1219.80 and, therefore, minor wave 1. It places us now in minor wave 2. I've labelled the start of 5 waves up from the 1010.91 low, on the assumption that we will get a zig zag type move up for wave 2, since we would be retracing the whole decline from 1219.80, not just the drop from 1131.23.
The alternate labelling assumes that the 5 waves down from 1131.23 is only wave (a) of [v] and that we are now retracing back up in wave (b). The double zig zag count I posted today would apply to the (b) wave.
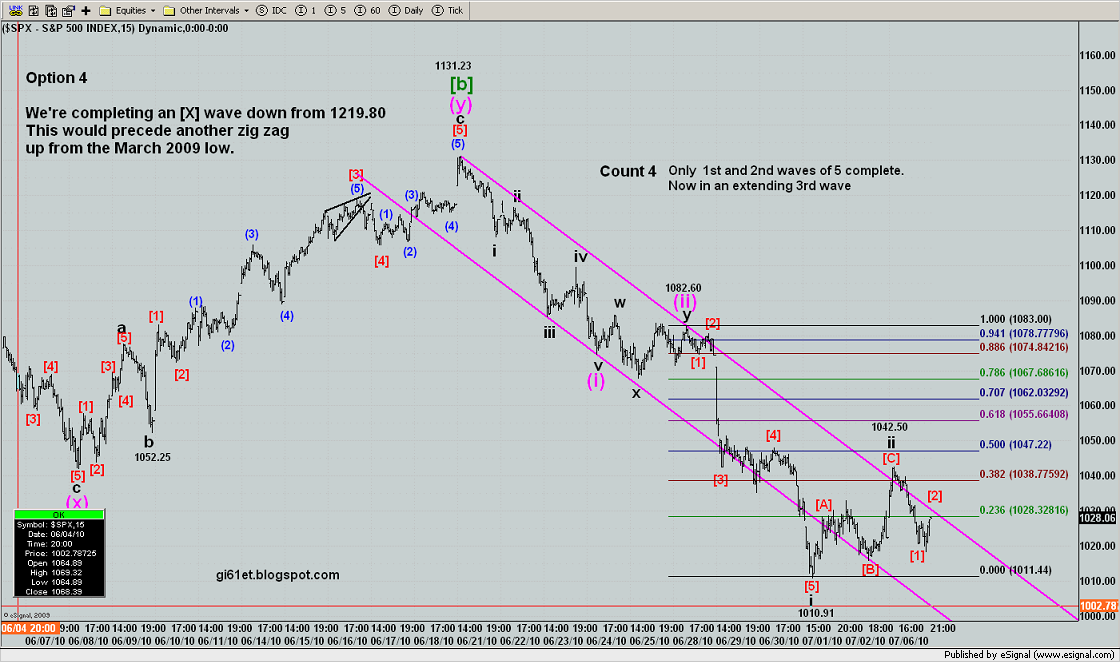
Option 4 - Wave [b] of minor Y within intermediate [X] topped at 1131.23
15 min chart:

I've applied Count 4 to the chart of this Option. It puts us in an extending 3rd wave down from 1131.23.
We've now retraced over 78.6% of wave i of (iii) - if we are in ii of (iii), this would be a good place for the rally to end
The retracement can't exceed 1082.60 if this count is correct. If it does, it'll be likely that Count 1 is in operation (see chart of Option 1 above).
Option 5 - Minor wave X within intermediate wave [X] topped at 1131.23. Now in minor Y down
9 min chart:

On the chart of this Option I've also applied Count 4, so the comments made in respect of Option 4 also apply here.

On the chart of this Option I've also applied Count 4, so the comments made in respect of Option 4 also apply here.
Here is the double zig zag count that I've applied to the charts of Options 1, 2, 4 and 5 and which would apply if the alternative labelling on Option 3 is in force:
Double zig zag:

As mentioned above, it may be complete at today's high, (which is how I've labelled it for the time being) or with a truncation at today's close, or we may have a little more upside to go to avoid a truncation (the way its labelled on the charts of the Options above caters for the latter two possibilities).