Alot of choppy sideways action again today. which means not much has been resolved since Friday.
The Options listed below are the different ways to count the move down from 1219.80. There are 5 that I'm following and they are set out on the 60 min counts page.
On the chart of each Option I have labelled one of the 2 remaining Counts for the decline from 1131.23. Each of these Counts could apply to any one of the Options, though what they mean may differ depending on which Option you are looking at. Count 1 shows 5 waves down from 1131.23 complete at 1010.91 and we are retracing the whole of that decline, while Count 4 shows a (i), (ii), i, ii decline from 1131.23 to 1101.91 and we are only retracing the decline from 1082.60 which is the wave i start point.
Here's how things stand after today:
Option 1 - Wave (ii) of [iii] topped at 1131.23
10 min chart:
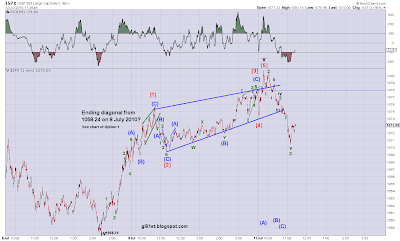
I've applied Count 1 to the chart of this Option. It assumes that we completed 5 waves down from 1131.23 to the low of 1010.91. From that low, I've labelled a double zig zag count with the (C) wave of [Y] possibly complete at today's high, applying the count I showed earlier, of the ending diagonal for wave 5 of (C) which started at the 1058.24 low.
It remains to be seen whether or not that count will survive - today's high is the invalidation point. If we take that out, there remains the count showing an ending diagonal from the 1039.93 low, which appears to be in its 5th wave - it has to stay below 1092.99 to remain valid.
So, we just have to wait and see what the market does next on this.
Option 2 - Wave [ii] topped at 1131.23
10 min chart:
For the decline from 1131.23 to 1010.91, I've applied Count 1 to the chart of this Option also.
For the move off the 1010.91 low, I've also shown a double zig zag, but the [C] wave of the second zig zag is labelled differently. For the 5th wave of [C] I've assumed an ordinary impulse in is progress. (see the chart below showing an impulse wave from 1058.24).
It could count complete at today's high, but we really need to see some decisive downside action to be convinced that it is a complete impulse. Perhaps taking out the wave 4 low at 1069.54 might be a start.
Option 3 - Wave [iv] of an ending diagonal completed at 1131.23
10 min chart:
I've also applied Count 1 to the chart of this Option, giving us 5 waves down from 1131.23 to 1010.91.
I've labelled this 5 wave decline as wave [v] of a leading diagonal down from 1219.80 and, therefore, minor wave 1. It places us now in minor wave 2. I've labelled the start of 5 waves up from the 1010.91 low, on the assumption that we will get a zig zag type move up for wave 2, since we would be retracing the whole decline from 1219.80, not just the drop from 1131.23.
I'm showing us currently in wave [3] of iii, which could well have been completed at today's high. If wave [3] is complete, wave [4] will have to stay above the wave [1] high at 1042.50 for the count as labelled to remain valid.
The alternate labelling assumes that the 5 waves down from 1131.23 is only wave (a) of [v] and that we are now retracing back up in wave (b). Its possible that wave (b) completed at today's high, in which case, we'd now be about to start wave (c) down.
Remember, if there is further downside to come, we must stay above 999.83 for the leading diagonal count to remain valid.
Option 4 - Wave [b] of minor Y within intermediate [X] topped at 1131.23
15 min chart:
I've applied Count 4 to the chart of this Option. It puts us in an extending 3rd wave down from 1131.23.
We've now retraced over 94.1% of wave i of (iii) - its still a valid 2nd wave, but its close to invalidating this count. Remember, the retracement can't exceed 1082.60 if this count is correct. If it does, it'll be likely that Count 1 is in operation (see chart of Option 1 above) and that will bring in the possibility that wave [c] of Y is done so we have also completed intermediate wave (X) - see the 60 min counts page.
I've shown the double zig zag count up from 1010.91. For wave (C) of [Y], I've shown the count for an ending diagonal from 1039.91 (the low of (B) of [Y]) making the whole of (C) an ending diagonal.
This diagonal looks like it still needs another up leg to complete the 5th wave of the diagonal. The 5th wave only needs to get above 1080.78 if the labelling is correct - but it has to stay below 1092.99 to remain a valid diagonal.
Option 5 - Minor wave X within intermediate wave [X] topped at 1131.23. Now in minor Y down
10 min chart:
On the chart of this Option I've also applied Count 4, so the comments made in respect of invalidation on Option 4 also apply here.
I'm also showing a further alternative way to count the rally from 1010.91. Its a single zig zag, but different from the one I've shown previously in that we would have wave [C] starting from the low at 1018.33.
I've shown wave [C] as complete at today's high. If its not, then this (i)-(ii)-i-ii Count may be invalidated and I'll switch it to Count 1 showing a complete 5 waves down from 1131.23 so that we'd be retracing the whole of the decline from there to 1010.91. It may not make a great deal of difference if we are in wave (ii) of [a] down, or wave [b].
Here are the charts dealing just with the last few day's action, showing the complete ending diagonal, the impulse up from 1058.24 which also looks complete and the ending diagonal that still appears to be in progress:
Complete ending diagonal - see the chart of Option 1 above:
Ending diagonal still in progress - see the chart of Option 4 above:


