Menu

Tuesday 21 September 2010

23;40 BST - Dollar Update

The dollar's not looking too good on the count that has it in intermediate wave (3) up. Today it has come very close to the low that I have labelled as wave (2) on the bullish count, as you can see from this75 min chart:

Dollar 75 min:


The alternate shown on the chart (its the first of the alternates I've had listed on the dollar page) implies alot more downside to come if that low at 80.085 doesn't hold.

Here's a closer look at how it may be counted on the bearish count:

Dollar 60 min:


If I count wave (E) of the triangle [B] wave as a triangle itself, then wave [C] of y looks like it might need one more low to complete. Its feasible that it could do that without breaching the 80.085 low, so this may be the best count for the bear case at the moment (unless the low is already in, of course).

If it can hold that low and take out 82.780, there's a reasonable chance that it'll go on to take out the high at 83.522. Whether that will be within the context of wave (3) up or whether it will still be the B wave on the alternate count, we'll have to wait and see as price action develops.

22:29 BST - SPX: 60 min time and price chart

This chart shows Gann based price levels from the 1040 low with a 4 day cycle and a channel with a lower line drawn through the first cross of the time and price lines after the start point of the channel at the 1039.70 low:

SPX 60 min time and price:


Its interesting how price has found resistance and support at these price levels and how, at the 1121 level it consolidated for so long right between two of the time cycle lines before this latest rally (see the yellow highlighted areas). 

The close today was right on one of those price levels. I've marked the next level up, which is at 1156 (the one after that is about 1173, but won't fit on the chart).

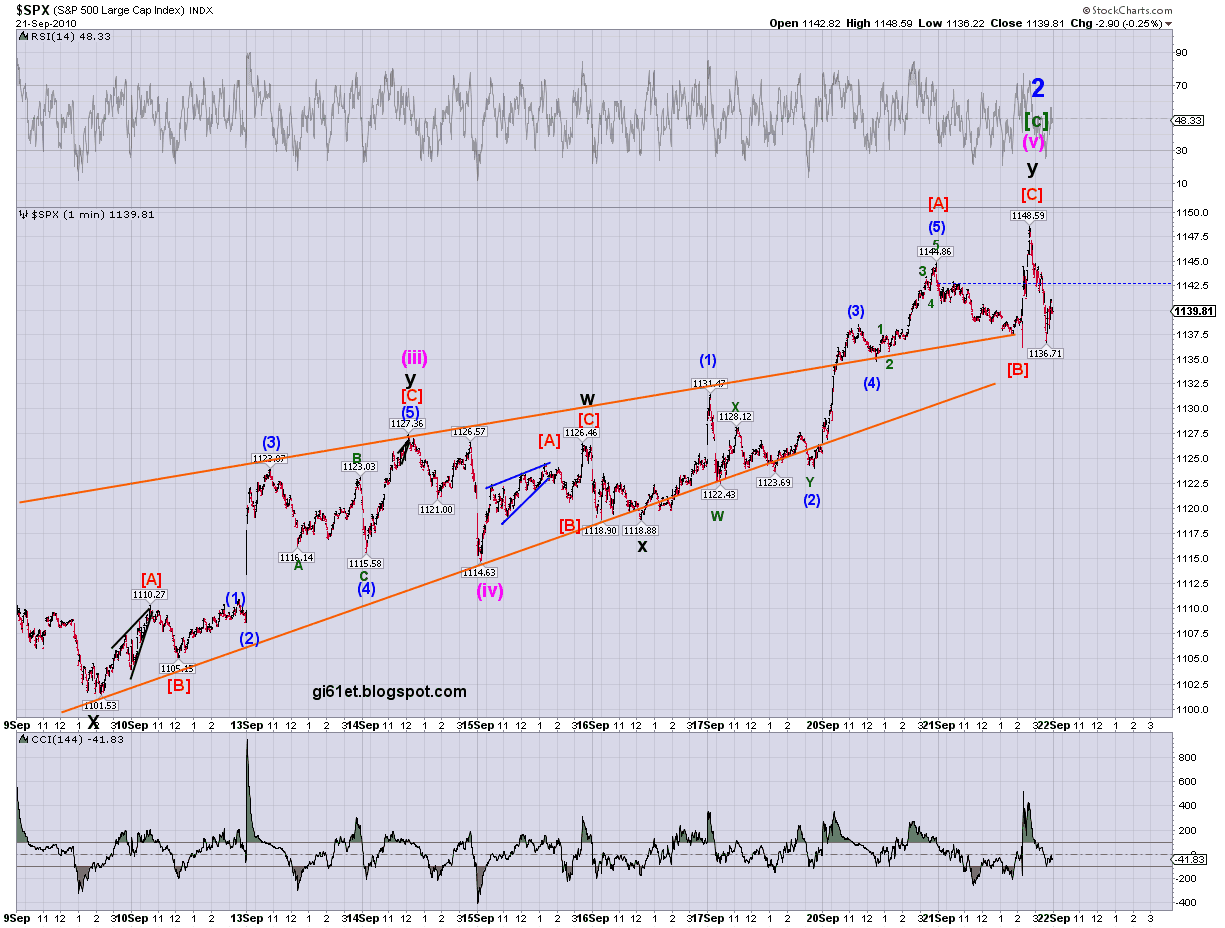
Its obviously well within the realms of possibility that the market could get to the next price level. I showed in the end of day update a possible count that has us still in wave (4) of [5] of an impulse up from the August low (see the fourth chart). Today's high would have been wave B of wave (4) which is forming an expanded flat on this alternate count. So, wave (5) of [5] would follow once wave C of (4) is complete.

As mentioned in the update, if that count is playing out, we'd have to stay above the wave (1) of [5] high at 1131.47 in wave (4). As long as we do that, the risk of a further high, possibly to the next price level shown on the above chart (or the next one at 1173), remains.

You can see from the chart how well price has moved within the upper half of the channel. So, a break down into the lower half may be an indication that the rally is over. A break down out of the channel altogether would probably confirm a top of some sort is in.

The next time line on the chart is tomorrow. This coincides with two cycles I showed last week which start from the March 2000 high - see that post here.

The RSI, MACD and MACD histogram show nice divergences. The MACD and its histogram show quite a large one going back to early September. The histogram and the RSI show nice divergences between yesterday's and today's highs. 

Its perfectly possible in light of this and the main wave counts shown, that the rally ended at today's high. However, if a top is in, we need to see the indicators move to bearish levels with a decline in price. Anything less than that (for example, the indicators fall away but price is only moving sideways) should be considered as a warning that further upside may be coming.

21:09 BST - SPX End of Day Update

On the 3 bullish to bearish Options set out in Friday's end of day update, its possible that we have seen the completion of 5 waves or a diagonal up from the August low at today's high of 1148.59  (the diagonal would be an ending or leading diagonal, depending on which of the Options you're looking at). 

Please refer to the 60 min charts in Friday's end of day update for context (the following charts are based on the bearish count shown in Option 1 in that update).

Here's the ending diagonal count:

SPX 1 min - diagonal from August low:


For this count we had to stay below 1150.84 in wave (v), which we did, so, assuming its complete, it remains valid.

Here's a close up:

SPX 1 min - diagonal from August low close up:


If its complete, a swift move below 1114.63, the wave (iv) low should be on the cards to start with and it should do it in a clear and impulsive manner. If  it doesn't behave in that way and/or fails to take out that low, I'd be suspicious that something else may be playing out, which might involve more upside.  

Here's the impulse wave count (these again use the count in Option 1  from Friday's end of day update, but assume that the rally from August is only wave (i) of [c] - I think that may now be unlikely and that its more probably all of [c] on this Option):

SPX 1 min - 5 wave impulse from August low:


The alternate that I posted this morning played out, with a further high. It now counts well as complete at today's high. However, I think it needs to drop below the low at wave [4] at 1119.77 to confirm. Having said that, I'm looking at the high at 1131.47 as an initial signal that its complete, since taking that out would preclude the possibility that wave (4) of [5] is forming an expanded flat.

Here's a close up:

SPX 1 min - 5 wave impulse from August low close up:


Whichever of these two counts represents what we have seen from the August low, if we have completed a rally from that low, we now have to see what kind of pullback we get in order to try to determine what that rally represented - whether it was a final rally before a larger move down (as suggested by Options 1 and 2 in Friday's end of day update) or if its just a temporary high which will be taken out, probably within the next few weeks, as the market moves to the April high and above (as suggested by Option 3 in Friday's end of day update).

We can't know which it'll be at this stage. The more impulsive any pullback is and the further down it gets, the more likely it will be that one of the bearish Options (1 or 2) is playing out. However, this will really only become likely if we take out the low at 1039.70 and then only confirmed if we take out the low at 1010.91. There's plenty of trading between where we are now and those levels, so all we can do is monitor and assess as price action develops.


For the moment,  I'm watching 1131.47, then 1119.77 and 1114.63 and if they're taken out, I want to see it happen with a clearly impulsive move.

18:47 BST - SPX Update: 5 waves down from 1144.86?

Its possible we've had 5 waves down, but its possible also to count it as corrective - its certainly moved like a corrective wave rather than an impulse:

SPX 1 min - 5 waves down from 1144.86?


I've labelled a possible ending diagonal for wave 5, but it could develop into an impulse if things are really getting bearish.

If we've had 5 waves down for the start of a larger down move, obviously, we have to stay below 1144.86 on the next move back up. If we're in wave (4) of [5] up, we need to stay above the wave (1) of [5] high at 1131.47.

16:30 BST - NYSE Tick bearish divergence against SPX highs

This divergence between the price action and the NYSE Tick occuring in an overbought area seems to be supporting a pullback of some sort in the market:

NYSE Tick:


We saw a divergence in the Mclellan Oscillator yesterday too. So maybe things are starting to at least line up for a reasonable pullback (if not the start of a larger move down).

15:38 BST - SPX Update: 5 waves up complete or one more high to come?

Its possible we've seen the end of 5 waves up from the August low, but the drop from yesterday's high doesn't look overly impulsive, although it is possible to count it as 5 waves down with a sideways correction now in progress. However, the alternate count on this chart (which I mentioned yesterday) suggests a further high might yet be needed:

SPX 1 min - 5 waves up complete, or one more high to come?


Unfortunately, I can't rule out the alternate unless we take out 1131.47 without making a new high first.