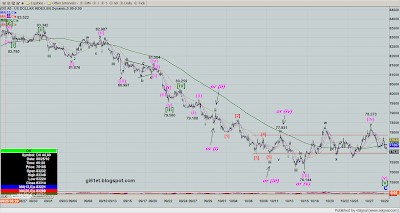
Since my last post on the dollar - see here - its moved more consistently with the more obvious count I felt might be playing out at that time, requiring a further low to complete wave C of (2) on the overall bullish count.
Here's the daily picture:
Dollar Daily:
You can see that in the last post the technicals suggested some upside to come, but with the main wave count I had, it seemed likely that this upside would be in the context of what I would label as wave (iv) of [v] of C of (2).
Looking at the updated daily chart above, we got the move up in the indicators and some upward movement in price. Price moved above the yellow highlighted area of congestion which is the area shown on the daily chart from the last post. This was bullish. However, it then moved right back down again - bearish. It then moved back above it - bullish. By yesterday, it had moved back below it - bearish.
This oscillating action would be more obviously consistent with a correction so I think that has to continue to be my main count for this overall bullish count for the moment. This means that we should see a new low below 76.144 at some point soon.
The indicators currently seem to confirm the possibility of a further decline. As I've noted on the daily chart, the RSI failed to make it above 50, the MACD histogram has been printing lower high bars, the MACD suggests it could be about to roll over and the stochastic failed to get to overbought and is now rolling over.
Here's the 80 min chart showing how I'm labelling wave C from the wave B high at 83.522:
Dollar 80 min:
Of course, we may still be in wave (iv) which could be forming as a triangle, with the decline into Friday's close being the d wave, so there could be another move up to come before wave (v) gets going.
I think if we take out the high at 78.273 at this stage, I might start thinking that 76.144 marked the end of wave C and (2) on this overall bullish count, as shown by the alternate labelling on the 80 min chart. Certainly, if we do that without taking out the low at 76.709, it might well become a distinct possibility. Here's how I would count the move up from 76.144 as the start of wave (3) up if that low marked the end of wave (2) down:
Dollar 10 min chart:
You can see from this chart why I've said above that if we rally above 78.273 without taking out the low at 76.709, the case for a bottom at 76.144 might well be strengthened.
Even if we drop below 76.709, it may just mean that we're still in wave ii, but we'd have to stay above the 76.144 low of course, to keep this alive.
So, taking out the low at 76.709 is going to suggest that the main count, for a new low below 76.144 is on the cards. If we fail to take out the 76.709 low but instead rally up again in 5 clear waves and take out the high at 78.273 the case for a wave (2) low at 76.144 would gain strengh, but it wouldn't be conclusive - we'd have to see whatever low we rally from above 76.709 hold on the next pullback.


