
On the counts that imply the rally from the 1 July low is a corrective one (Options 1, 2, 4 and 5) I've labelled completed double/single zig zags ending with a truncation at 1099.08.
On the count that places us in a 5 wave move off the 1 July low (Option 3), which would be part of a larger correction up, I've labelled the high at 1099.46 as wave (iii) of that advance and the subsequent decline as wave (iv).
On the count that places us in a 5 wave move off the 1 July low (Option 3), which would be part of a larger correction up, I've labelled the high at 1099.46 as wave (iii) of that advance and the subsequent decline as wave (iv).
The Options are the different ways to count the move down from 1219.80. There are 5 that I'm following and they are set out on the 60 min counts page.
Today's action still leaves open the question whether the rally from 1 July has completed a corrective move or whether its only all (or maybe, part) of a larger correction up.
Here's how things stand after today:
Option 1 - Wave (ii) of [iii] topped at 1131.23
15 min chart:

Five waves down from 1131.23 on this Option represents wave i of (iii) of [iii] of minor 1. The double zig zag I have labelled from the 1010.91 low would be wave ii of (iii), so implies a wave iii of (iii) decline to follow.

Five waves down from 1131.23 on this Option represents wave i of (iii) of [iii] of minor 1. The double zig zag I have labelled from the 1010.91 low would be wave ii of (iii), so implies a wave iii of (iii) decline to follow.
The 1099.08 high is the invalidation point for the completion of wave ii on the double zig zag as labelled.
I've labelled a (1)-(2)-1-2 to account for the decline since. The invalidation points are 1079.64, which would eliminate the 1-2, and then 1098.66, which would call into quesion whether we did top at 1099.08.
I've labelled a (1)-(2)-1-2 to account for the decline since. The invalidation points are 1079.64, which would eliminate the 1-2, and then 1098.66, which would call into quesion whether we did top at 1099.08.
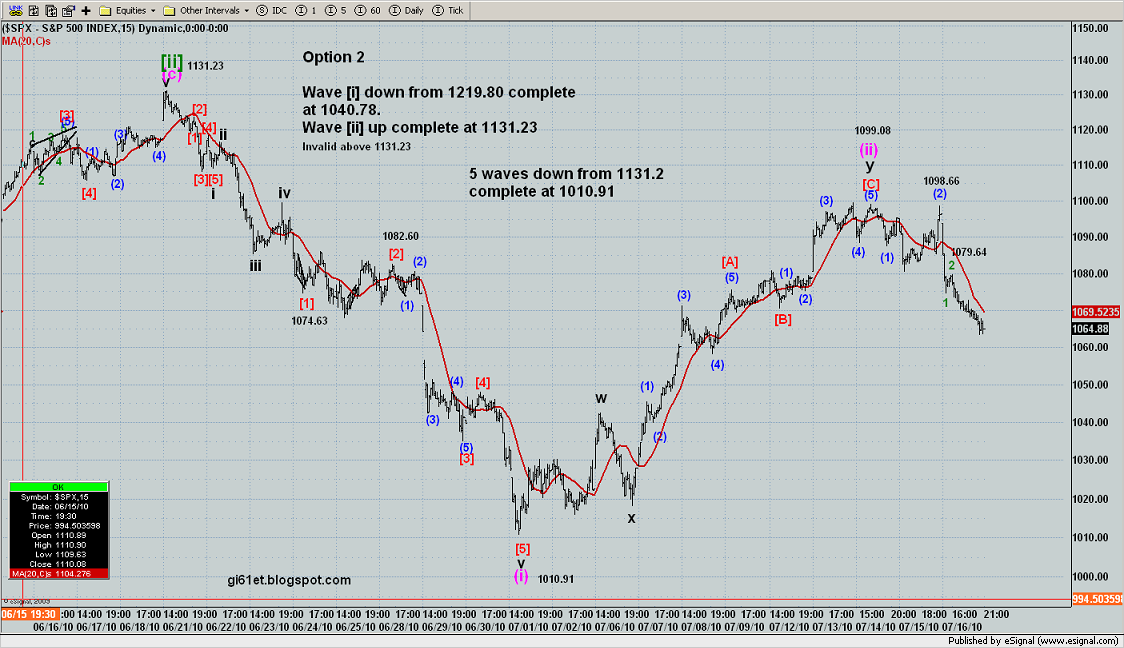
Option 2 - Wave [ii] topped at 1131.23
15 min chart:

For this Option, five waves down from 1131.23 represent wave (i) of [iii] of minor 1 down. The double zig zag up from 1010.91 would be wave (ii) of [iii], so, assuming its complete, we would be in wave (iii) of [iii] down.
This is the same labelling as on the chart of Option 1 for the rally from 1 July and subsequent decline, so the invalidation points are the same.
Option 3 - Wave [iv] of an ending diagonal completed at 1131.23
15 min chart:

For this Option, 5 waves down from 1131.23 to 1010.91 could be wave [v] of a leading diagonal down from 1219.80 and, therefore, minor wave 1.
It places us now in minor wave 2 up. I've labelled the start of 5 waves up from the 1010.91 low, on the assumption that we will get a zig zag type move up for wave 2, since we would be retracing the whole decline from 1219.80, not just the drop from 1131.23.
I'm showing us having completed wave (iii) (at 1099.46) of what I'm assuming at the moment will be a 5 wave move for wave [a] of minor 2. This would mean the current pullback should be wave (iv) of [a]. This count would be invalidated if that assumed wave (iv) were to fall below 1028.74, the wave (i) high.
Today's action may not be far off completing wave (iv) - its retraced about 38.2% of wave (iii), which is about right for a 4th wave.
The alternate labelling assumes that the 5 waves down from 1131.23 is only wave (a) of [v] and that the retracement back up was wave (b). Assuming its complete, we'd now be in wave (c) down and the count shown on the charts of the other Options would likely be in effect.
Remember, if there is further downside to come, we must stay above 999.83 for the leading diagonal count to remain valid.
Option 4 - Wave [b] of minor Y within intermediate (X) topped at 1131.23
15 min chart:

For this Option, 5 waves down from 1131.23 would be wave (i) of [c] of minor Y and the double zig zag up from 1010.91 would be wave (ii) of [c].

For this Option, 5 waves down from 1131.23 would be wave (i) of [c] of minor Y and the double zig zag up from 1010.91 would be wave (ii) of [c].
However, as mentioned previously, counting a complete 5 waves down to 1010.91 does bring in the possibility that wave [c] of Y is done so we have also completed intermediate wave (X) - see the 60 min counts page. That would put us now in a minor wave A rally and eventually take us to new highs. If wave (X) did end at 1010.91, then the impulse wave I have labelled on the chart of Option 3 would apply here.
For the moment, I've assumed we are starting wave (iii) of [c] down with a (1)-(2)-1-2 from the 1099.08 high. The invalidation points are the same as for Options 1 and 2.
Option 5 - Minor wave X within intermediate wave (X) topped at 1131.23. Now in minor Y down
15 min chart:

On this Option, 5 waves down to 1010.91 would be wave [a] of minor Y down and the retracement would be wave [b]. If its over, we would now be headed down again in wave [c] to complete minor Y.
I've labelled a single zig zag on this chart, but its end point is the same as for Options 1, 2 and 4, namely, the high at 1099.08, so that would be the beginning of wave [c]. The same invalidation points stated for options 1, 2 and 4 apply here.
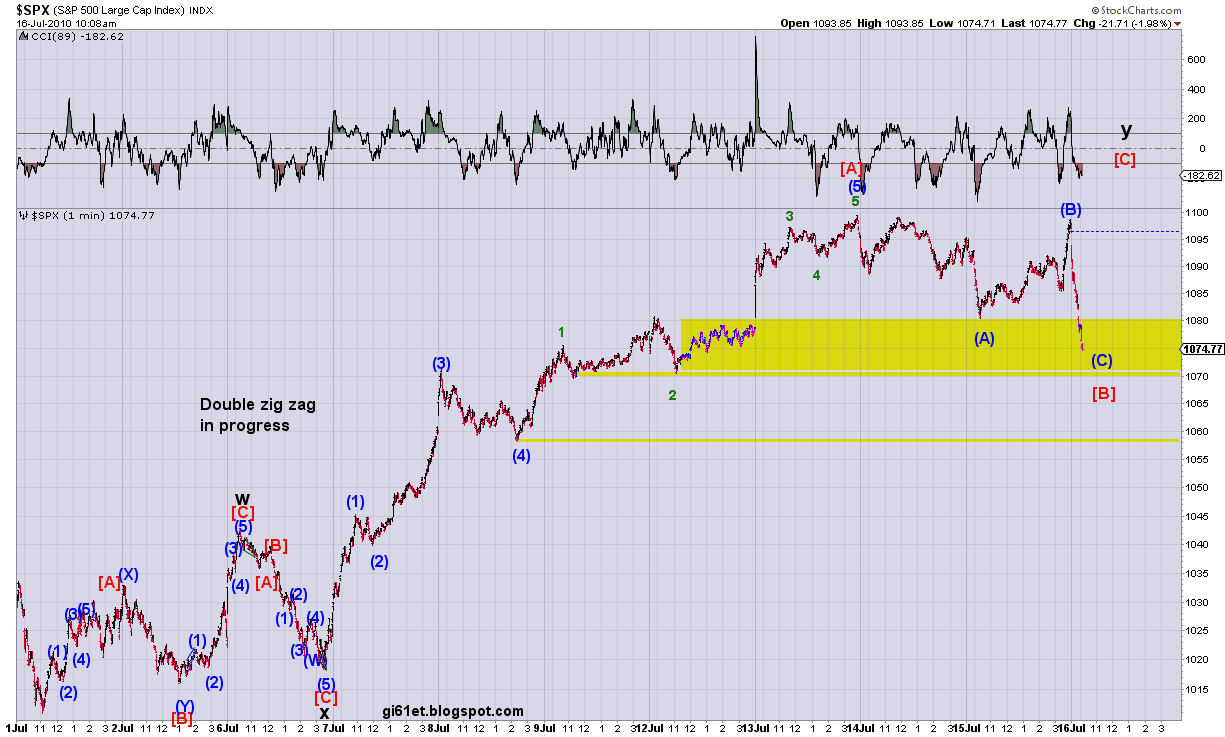
Here's an update of the chart I posted earlier showing a possible bearish count for today's move - I've added an alternative to it as well:
SPX 1 min:

Ignore the degrees of the wave labels. I've labelled it as a (1)-(2) down, with wave (3) now in progress and subdividing. However, the alternative (which I probably prefer) is that we may have completed a leading diagonal down from the 1098.66 high of yesterday. If that's correct, looking at the charts of Options 1, 2, 4 and 5, I would probably count it as the first wave of wave (3) (the labelling on the chart above is one degree higher than that shown on the charts of the Options).

On this Option, 5 waves down to 1010.91 would be wave [a] of minor Y down and the retracement would be wave [b]. If its over, we would now be headed down again in wave [c] to complete minor Y.
I've labelled a single zig zag on this chart, but its end point is the same as for Options 1, 2 and 4, namely, the high at 1099.08, so that would be the beginning of wave [c]. The same invalidation points stated for options 1, 2 and 4 apply here.
Here's an update of the chart I posted earlier showing a possible bearish count for today's move - I've added an alternative to it as well:
SPX 1 min:

Ignore the degrees of the wave labels. I've labelled it as a (1)-(2) down, with wave (3) now in progress and subdividing. However, the alternative (which I probably prefer) is that we may have completed a leading diagonal down from the 1098.66 high of yesterday. If that's correct, looking at the charts of Options 1, 2, 4 and 5, I would probably count it as the first wave of wave (3) (the labelling on the chart above is one degree higher than that shown on the charts of the Options).
If we did complete a leading diagonal at today's low, we might have to expect a significant rally on Monday - 78.6% of the decline from 1098.66 is about 1091.
If the other count applies, we could well see a large move down as wave (3) really gets underway.
If we do rally, the leading diagonal count becomes more likely if we get above the low at (1) on the above chart, 1074.71. This is on the basis if we are in wave (3) down from the 1098.66 high, we probably shouldn't be taking out that low at this stage. We then have to watch the 1098.66 high since if that is taken out, the chances are that we are still in a double zig zag correction, as shown on this chart that I posted earlier:
SPX 1 min - double zig zag still in progress:

The other possibility, if 1098.66 is taken out, would be that the count on the chart of Option 3 is playing out, so we would have to expect a substantial rally which could take out the high at 1131.23.
Have a good weekend!


