Menu

Tuesday, 24 August 2010

21:14 BST - SPX End of Day Update

In my post earlier today I summarised the bullish counts I'm following and which remain valid until we take out the low at 1010.91. You can see that post by clicking here.

So, I'll concentrate this post on the bearish counts. You should refer to the 60 min counts page to see the context of the shorter term charts I'm showing here and to understand what the Options referred to below mean.

On all of the following counts, I'm assuming that we will get 5 waves down from the high of 1081.58.

The main count is that, from the high at 1129.24, we've seen a i-ii-[1]-[2] down (using the degree labels applicable to Option 2), as illustrated on this chart:

SPX 1 min - from 1129.24, a i-ii-[1]-[2]:


At the moment, the count has us in wave [3] of iii. I would hope to see wave iii end somewhere in the region of 1003 where it would be a 1.618 extension of wave i. However, more modest targets might be the 1.236 extension at about 1026 or the 1.382 extension at about 1017. Wave iii should, ideally, break down well below the channel I've drawn on the chart.

In the meantime, once we get 5 waves down from 1081.58, that will mark the end of wave [3] of iii. We would then be in wave [4] of iii up. We'd have to stay below the wave [1] of iii low at 1063.91 in such a retracement, otherwise the count would be invalidated. So, on this count, the retracement following the completion of 5 waves down from 1081.58 would be relatively modest.

If the 1063.91 level were to be violated in an assumed wave [4] retracement, that does not mean the end of the bear case. There remain other ways to count the decline from 1129.24 on the overall bearish counts. It may be important to be aware of them in case we do invalidate the above count as described and also because if they are in fact the correct counts for the decline from 1129.24, they could determine the level to which retracements may get once we get 5 waves down from 1081.58.

Here are the other counts I'm following:

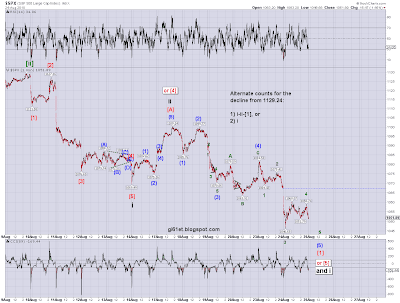
1) SPX 1 min - from the 1129.24 high, a i-ii, with [1] in progress, or still in wave i:


There are two possibilities shown on this chart as you can see. 

If the first one is playing out, once we make 5 waves down from 1081.58, that will complete wave [1] in a i-ii-[1] sequence. We would then be retracing the decline from 1100.14 in wave [2].  It could go all the way back up to 1100.14 without invalidating the count, but maybe more likely we'd see a 50%-61.8% retracement which would be the  1074 to 1080 area, depending one where we bottom.

If we invalidate this count by moving above 1100.14 in an assumed wave [2], it may be that the second count shown is playing out. On that count, once we have 5 waves down from 1081.58, we'll have completed wave i down from 1129.24. This means we'd be looking at a retracement back up in wave ii. That could go all the way back up to 1129.24 without invalidating the count. However, we'd probably expect a wave ii rally to end in the 50%-61.8% level which would be about 1085 to 1097, depending on where we bottom. 

2) SPX 60 min - from 1129.24, a leading diagonal for wave (i):


The labelling on this chart uses the degrees from Option 3.

I posted this chart earlier today. So far, it remains valid since we haven't moved below 1045.35 in what I've labelled as wave v of the diagonal.

However, as I mentioned in the earlier post, if the decline from the wave ii high at 1100.14 is still part of wave iii, the level that would invalidate the diagonal would be 1040.39 because that would make wave iii longer than wave i. So, really, to invalidate this possibility altogether, we need to take out 1040.49 in the decline we seem to have resumed at the end of today.

For the moment, it seems possibly more likely that we may still be in wave iii given that we haven't seen much of a retracement up since the low at 1046.68 and a retracement following the completion of a diagonal is meant to be sharp. However, it may be too early to draw this conclusion. If we take out the low labelled v and (i) then we can switch over to that.

Once we complete the diagonal, assuming we haven't already done so, as mentioned, a sharp retracement should follow. A level of 78.6% is considered normal after a diagonal. If we did end the diagonal at 1046.88, such a retracement would take us up to about 1112, so if this count is playing out, a wave (ii) retracement up to that level is certainly something that could cause doubt to creep into the bear count.

For now, going back to the main count shown in the first chart above, here's a close up:

SPX 1 min close up:


Sorry - that's the best I can do with that wave (4) at the moment! Still, I think it works. If its correct, we should now be in wave (5) of [3] of iii down if you refer back to the slightly bigger picture shown on the first chart above. We could see a low to this somewhere between 1045 and 1040 (the 1.236 to 1.618 extension of wave (1) of [3]). It could extend further, in which case a possible target might be the 2.618 extension of wave (1) at around 1029. Let's just hope it doesn't truncate instead of giving us a nice 5 waves down from 1081.58, since that would only cause (more) confusion.

18:54 BST - SPX Update: 1 min close up

Possibly into wave 3 of (5) down to complete wave [3] of iii:

SPX 1 min close up:


There's a risk we're still in wave (4), but it does look like its had enough time and retraced high enough to be complete at 1060.07.


18:37 BST - SPX Update: A look at the bullish counts still in play

Just a quick post to show that the three larger bullish counts I'm following which are summarised on the 60 min counts page all remain intact even after today's initial sell-off. Here they are updated:

SPX 60 min - single zig zag from 1010.91 still in progress:


This count applies to all of the Options mentioned on the 60 min counts page. Today's decline would be the (c) wave of [b] before we rally in wave [c] to complete the zig zag. We seem to need one more leg down to complete 5 waves for (c).

SPX 60 min - first bullish alternate under Option 4: impulse up from 1010.91:


This count has been relabelled since the decline below 1056.88 invalidated the [i]-[ii]-(i)-(ii) count shown on the 60 min counts page. It simply means we have only completed wave [i] of minor A up and wave [ii] is in progress in the form of an expanded flat. Its not a great count, but looks valid to me.

Again, we seem to need another leg down to complete the 5th wave  of wave v of (c).

SPX 60 min - second bullish alternate under Option 4: leading diagonal for wave A of (Z):


As with the above counts, it looks like we need another leg down to complete 5 waves for wave [c] of B before we see a rally in wave C.

Assuming we make a 5th wave down (which is also what I'm expecting to see on the bearish counts) I'll be watching the rally up from there closely. 

On those bearish counts, the rally will be wave [4] of iii (using the Option 2 degrees) and will have to stay below the low of wave [1] of iii which is at 1063.91. If we take that out in an assumed wave [4], the labelled count would be invalidated and it would be a warning that the bearish counts (as currently labelled) are not playing out and that one of these bullish counts could be in play.

Its possible that (with some re-labelling) a new low today would be the end of wave [1] down from 1100.14 instead of where it is currently placed. If that's correct, then it could retrace all the way back up to 1100.14 and we'd still be in the bearish count. However, my first reference point for the purpose of guarding against these bullish counts would be that 1063.91 low mentioned above.

The invalidation point for all of these bullish counts is the low at 1010.91, so they could remain valid for a while yet unless we start to see more significant declines.

16:15 BST - SPX Update: 1 min chart close up

If this labelling is correct, we've retraced 38.2% of wave (3) in this wave (4) of [3]. Combined with the median line of the black pitchfork on the 15 min chart in my previous post, this would be a really nice place for this rally to end:

SPX 1 min close up:


Let's see if it plays out or not or if we have to start giving some thought to the other counts.

16:06 BST - SPX Update: 15 min pitchforks

I mentioned this morning how price action yesterday seemed to be confirming the validity of the red fork on the 15 min chart (see here). Well, what we've seen today also seems to be validating it as an important fork to watch:

SPX 15 min pitchforks:


You can see that we bottomed (so far) right at the median line of this fork. If things are truly bearish we ought to see this get broken to the downside at some point.

In the meantime, I've added a turquoise fork given the breakdown out of the black one. I would hope to see the current rally from the low get pushed back from around where we are now, at the median line of the black fork, but certainly by the upper line of the black fork at most. A rally much higher would start to raise questions about the immediately bearish case of a i-ii-[1]-[2] down which now has us in [3] of iii.

On my labelling, the count shown in the 1 min chart in my last post won't be invalidated unless this current rally which I would label as wave (4) of [3] ends above the wave (1) of [3] low at 1063.63 [EDIT: SORRY - should have said 1069.63!]. However, I'll be keeping a close eye on these forks for any earlier signs that that low might get taken out.

15:30 BST - SPX Update: 1 min chart: bouncing from lower channel line support

Although the 60 min chart I just posted shows that we're in an area of very little real price support, here's a 1 min chart I've posted before showing the base channel I've had drawn in for several days - we're right at the lower line and price has bounced from there:

SPX 1 min from 1129.24 high:


If we're in wave [3] of iii as the count suggests, we certainly shouldn't get back to the top of the channel. If we do, then something else is obviously going on - perhaps only one of the near term bullish counts I mentioned earlier or the leading diagonal 1st wave down shown in my last post. I'd like to see a break down out of the channel and perhaps a backtest from below that is pushed straight back down if the bear case is in play.

15:17 BST - SPX Update: 60 min chart - possible leading diagonal from 1129.24

This is more like the action I've been describing as being necessary for us to see in order to increase confidence in the bear case. We still only have 3 waves down from 1081.58, so the two near term bullish possibilities I mentioned yesterday and this morning (see this morning's post here) are still viable, even if perhaps less likely. Hopefully we can get a clear 5 waves down from 1081.58 to pretty much rule them out.

Something else to keep an eye on is a possible leading diagonal for wave (i) - I'm showing this one using the degrees relating to Option 3 (see the 60 min counts page).

SPX 60 min - leading diagonal from 1129.24:


As noted on the chart, if its a leading diagonal and we're in wave v, wave v can't get below 1045.35 since that would make it longer than wave iii. If we don't get below that level on this decline, this count may be something to watch out for since a retracement of this diagonal for wave (ii) could be sharp.

I'd prefer to see the count that has us in wave iii of (iii) down (using the Option 3 degrees) play out since it would probably mean more downside now. As I said at the weekend and in the updates since, I really think we need to see these 3rd of 3rd waves get going to the downside if we are actually in the bear counts - a wave (ii) retracement after a leading diagonal at this stage would just mean further delay in seeing that kind of action. Hopefully we can rule this one out soon (although we'd also have to take out 1040.39 to preclude counting the decline from 1100.14 as wave iii of a slightly larger leading diagonal).

In the meantime, you can see from the chart that we are now into an area of price void with little or no price support down to 1010. It doesn't mean that the market can't just stop falling, but in theory, there's nothing really to stop it.


9:04 BST - SPX Update: 15 and 60 min charts and more on the near term bullish potential and what would help eliminate it

I mentioned in last night's end of day update the risk of near term bullish potential if a) we haven't yet completed wave [2] in the i-ii-[1]-[2] sequence from the high at 1129.24; or b) we only bottomed in wave i at the 1063.91 low and wave ii is still in progress. You can read the end of day update here.

The reason I mention this, aside from the wave count, is the behaviour of the technical indicators on the intra day timframes. I noted at the weekend (see the post here) when I had labelled the late Friday rally as wave (A) of [2], that I expected we'd see some negative divergence occur with price making a new high in wave (C) and the indicators, which should make lower lows against that high. Yesterday, we saw the high labelled (A) taken out but there was no negative divergence in the indicators, as mentioned in my posts during the day.

Now, its not compulsory to have such divergences between price and the indicators, but it does go some way towards confirming that a top of some sort has been made. So, I think its sensible to stay alert to the two near term bullish possibilities I mention above. Having said that, the intra day charts do look bearish.

Here's the picture I'm looking at:

SPX 15 min:


You can see from my comments on this chart that the indicators paint a bearish picture so support more downside to come (we'll just have to wait and see whether any such downside turns out to be a (B) wave decline or if is a 3rd of a 3rd wave down).

Its also nice how the rally into 1081.58 stopped right at the intersection between the rising lower line of the bullish green fork and the falling upper line of the bearish red fork. This seems to confirm the validity of the red fork and that the green fork is unlikely to have any influence on price (at least not bullish influence).

There was further confirmation of the red fork with the second rally into its upper line later on yesterday. You can see how price quickly turned back down from there.

I've drawn in a new downward fork in black. If we're in wave [3] of iii down, this may contain that move, with price at least moving to its median line and perhaps following it down.

SPX 60 min:


The same lack of bearish divergence between the indicators and price into the high at 1081.58 is highlighted here, but again, the indicators are bearish, both in their curent configuration and/or in their behaviour into that 1081.58 high despite the lack of bearish divergence, as noted on the chart.

In both of these charts, the current 3 wave look to the decline from 1081.58 is apparent and with one decent sized gap up or rally, the bearish picture can change quickly, which is why we have to stay alert to the possibility that this is only a (B) wave in wave [2] or a [B] wave in wave ii depending on which of the near term bullish possibilities mentioned above may be playing out. 

As mentioned in yesterday's end of day update, what I would like to see to reduce the risk of the decline from 1081.58 being a (B) wave is a clear 5 wave decline from 1081.58 (taking out 1063.91 won't be enough if we only do it in 3 waves since the decline could still be a (B) wave in an expanded flat). 

I think we've seen too many potential ones and twos forming to the downside in recent action that we now just want a straightforward impulse down without any further messing about. This would help eliminate the near term bullish potential mentioned above, though not the longer term bullish potential mentioned in the end of day update (which remain valid until we take out 1010.91).

If we're in wave [3] of iii as my labelling suggests, then ideally, we should see it extend to at least 1.236 x wave [1] of iii That would take it to about 1035. In my view, this is what the bearish counts call for, so if it doesn't happen, those near term bullish counts have to remain on the radar.