Menu

Friday 8 October 2010

21:13 BST - SPX End of day Update

On the 3 Options set out on the 60 min counts page, I'm still waiting for the end of 5 waves up from the August low  to mark the end of minor 2 (or, now less likely, (i) of [c] of 2) on Option 1, the end of wave X on Option 2 or the end of wave [i] of C (or (i) of [iii] of A) on Option 3.

We made another new high for the rally from the August low, but the question remains whether that new high is the end of the rally from that low or whether there is still more upside to come.

You can see the bigger picture into which the following charts fit by going to the 60 min counts page where you'll find the 3 Options I'm following for the move down from the April 2010 high.

These charts are labelled as if Option 3 is playing out:

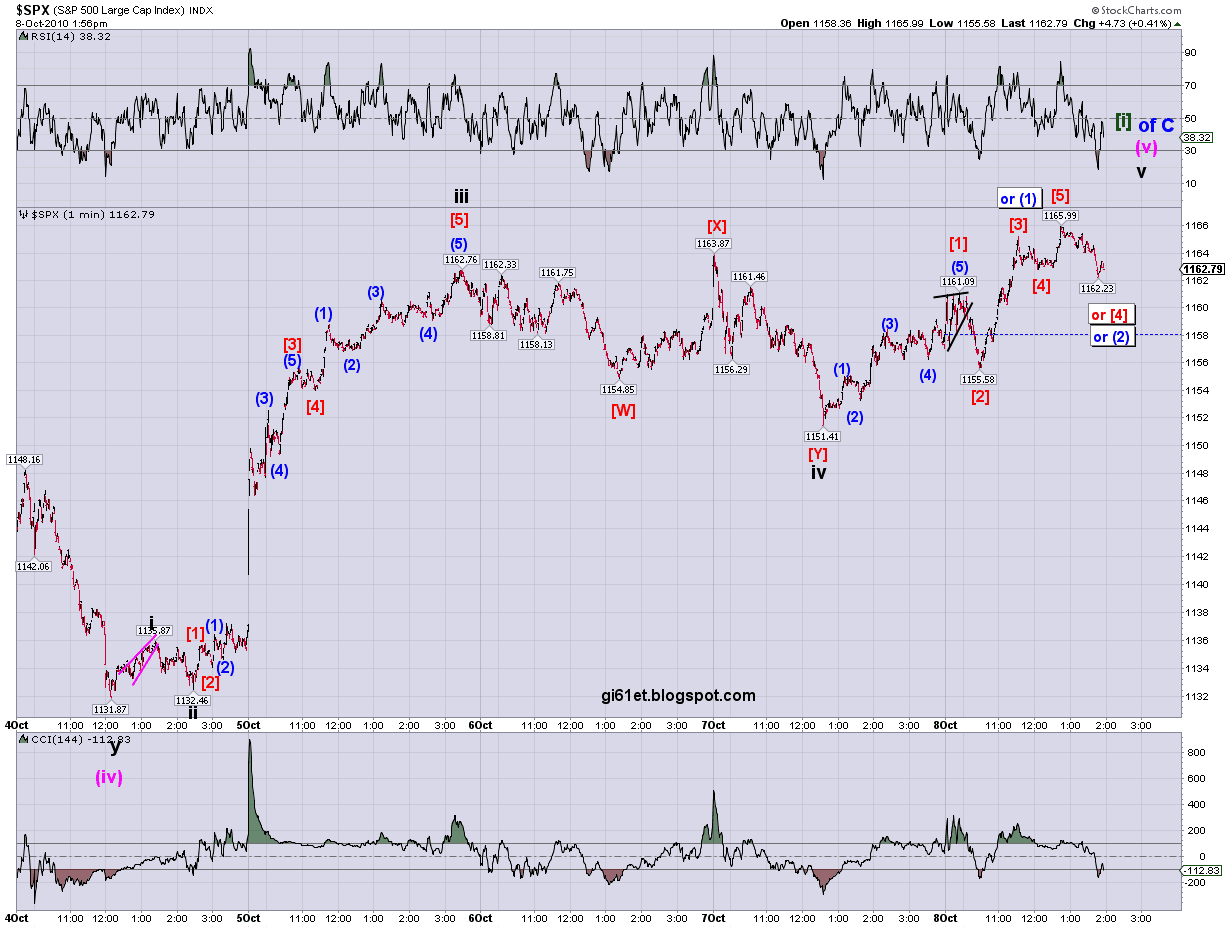
Chart 1: SPX 1 min - 5 waves up from the August low with a possible ending diagonal for wave (v): 


This is the chart I posted intra day showing a possible ending diagonal for wave (v). It could be complete at today's high, or that high may only have been wave iii. If we decline to the black dotted line, then I'd count the diagonal as complete. 

The question then will be whether or not it was a diagonal or whether we're seeing the development of ones and twos in a more bullish move up. Taking out the low at 1151.41 would make me start to think that it was a diagonal, but it wouldn't be conclusive - we'd have to take out the low at 1131.87 to get confirmation.

The other possibility is that we're just seeing a straight impulse wave up from the wave (iv) low at 1131.87, with the low at 1151.41 being wave iv of (v).This is shown in the close up chart I've been posting. For this possibility, there are a number of ways to count the move up from the wave iv of (v) low at 1151.41 as you can see from the chart below:

Chart 2: SPX 1 min - 5 waves up from August low with wave v of (v) starting at 1151.41:


The main labelling assumes we're on the verge of completing wave v of (v) if we haven't already done so. The alternate count labelled is more bullish and assumes we're still in wave [3] of v of (v). If we were to take out 1161.60 at this stage, the main labelling would become the more likely, although I'd then like to see 1155.58 get taken out very quickly after that in order to avoid the possibility that wave (2) has formed a very complex expanded flat type of correction (this seems unlikely at this stage, in my view).

If we can take out those two levels, I would then want to see a swift move to below 1151.41 and then, of course, 1131.87 would be the real focus.

Don't forget the other possible way to count this which I mentioned in an intra day update yesterday -  the high at 1163.87 may have been wave i of (v) and the decline we saw from there to 1151.41 was wave ii. This would mean a potentially substantial rally coming in wave iii. I'm still thinking this count would be low probability since wave ii  would only be a 38.2% retracement of the rally from 1131.87, which is perhaps rather shallow for a 2nd wave, but also because it might make wave (v) somewhat out of proportion to wave (i) in the rally from the August low. However, we'll have to see how price action develops. Only taking out the 1131.87 low would eliminate this.

So, the levels on my radar after today'a action are 1161.60, 1155.58, 1151.41. If we can take those out, the odds increase that a top for the rally from the August low is in. However, this won't be confirmed until we take out 1131.87 on the counts as I have them labelled.

Have a great weekend!

19:13 BST - SPX Update - the 60 min may be starting to show signs of a top

There are some nice divergences in the technical indicators on the 60 min chart that hint at a top for the rally from the August low being not too far off - they do look like they're starting to roll over:

SPX 60 min:


Now we just need some bearish price action which is also confirmed by these indicators moving to bearish levels: RSI to 30, CCI to -100, MACD and its histogram below zero, -DI above the +DI and the ADX above 25 indicating a strong downtrend (its interesting that the rally from the October low didn't push the ADX above 25 - that suggests underlying weakness to me).

A move down in price that doesn't have this effect on the indicators is likely a warning that the decline is just a correction. Equally, price moving sideways while these indicators move to bearish levels is also likely to be a warning of more upside to come.

18:58 BST - SPX Update: Possible top in, but beware of the alternatives still in play

Its possible that we've completed 5 waves up from the 1151.41 low to complete wave v and (v):

SPX 1 min:


However:

1) until we take out 1161.09, we could still be in an expanded flat wave [4]; and 

2) until we take out 1158.58, we could be in an expanded flat wave (2); and

3) until we take out 1151.41, we could only have seen wave [1] of v at today's high.

17:58 BST - SPX Update

With what should have been wave (2) of [3]  (see my last post) being so shallow a retracement, the alternative I mentioned in the last post, that the rally from 1155.58 was the whole of [3] seems like a better count currently:

SPX 1 min:


Taking out the wave [4] low at 1162.79 would increase the odds in favour of this. However, be aware that 5 waves up from 1151.41 could be wave [1] of v, not the whole of v - we have to take out the low at 1151.41 to confirm the end of the rally from that low.

16:52 BST - SPX Update - bullish count wins: impulse or ending diagonal for wave (v)?

So, the bullish count wins. Its possible  that wave (v) is forming an ending diagonal starting at 1131.87, as shown on the following chart:

SPX 1 min - wave (v) in progress - possible ending diagonal:


If its labelled correctly, then wave iv of the diagonal needs to stay above the black dotted line, otherwise, the diagonal is invalid and I'll be looking for a straight impulse wave up from the 1151.41 low. As to that, here's the close up:

SPX 1 min - bullish count close up - looking for 5 waves up from 1151.41:


Its possible that the high labelled (1) of [3] is the whole of [3] - if that's the case, wave [4] must stay above the wave [1] high at 1161.09. If we take that out, I'll assume that the labelling above is correct. If we drop below 1155.58, this impulse wave up from 1151.41 will be questionable and I'll be focusing then on the ending diagonal possibility.

16:22 BST - SPX Update on the bullish and bearish counts

Until we take out the high at 1163.87, the bear count stands, albeit with adjustments as price action develops. Here is how I'm counting it now:

SPX 1 min - bear count:

I've changed it from an (A)-(B)-(C) to a (W)-(X)-(Y). So, 1163.87 remains the level to watch to the upside. 

To the downside, if we take out today's low at 1155.58, the bullish count will start to look very dodgy, but it won't be ruled out until we drop below 1151.41. 
Here's the updated bullish count:

SPX 1 min - bullish count:

Wave [2] retraced 61.8% of wave [1]. I can count 5 waves up from the wave [2] low either complete or nearly complete, so I've labelled it as wave (1) of [3], but if its really bullish, it may just extend higher before its complete.

Again, we really need to stay above 1155.58, but the 1151.41 low is the critical one.

15:16 BST - SPX Update: Possible count for 5 waves up from 1151.41

The action this morning could be an ending diagonal 5th wave in the move up from the low at 1151 41. Here it is on the chart of the near term bullish count (on the bearish count the 5 waves up from that low would be wave (C) of [2] in a new down move - see Chart 1 in yesterday's end of day update):

SPX 1 min - 5 waves up from 1151.41:


I can count the diagonal as complete at the high of 1161.09, but its equally possible that it still needs one more high. If we take out 1157.24, I'd look at it as complete. Also, reaching the dotted black line would suggest its complete.

Once we have 5 waves up from 1151.41, we need to stay above that level for the bullish count and we have to break below it for the bearish count. Nice and simple!