Menu

Thursday 10 June 2010

22:38 SPX Very bullish count update

I can't say I'm enamoured by this count if we're supposed to be in wave [iii] up. Its either extremely bullish with all those 1,2's, or its extremely wrong! 

I'd say maybe we're still in wave [ii], so the low at 1042.17 was just wave (a) of [ii] and we're now in (b), but given that we were less than 2 points away from taking out the 1040.78 low with wave [ii] as labelled, it wouldn't leave much room for wave (c) down. Still, stranger things have happened. 

If we're in this very bullish count, I think it needs to start acting like it pretty quickly, otherwise it just becomes very doubtful.

22:20 SPX Update

If we are in wave ii of (iii) of [iii] down, we ought to see this correction stay within a correction channel. You can see from the 4 min chart below that there is a nice channel for the move up from 1042.17 and we're right at the upper channel line. Interestingly, as you can see, this channel is pretty much parallel to the correction channel formed during wave (ii).

We're also at a level of price resistance which happens to coincide with the 70.70% retracement level. Then there are those fib relationships I mentioned in the 21:22 BST post. So, good reasons to think that we may have come to the end of wave ii, if that is the correct count. 

If we break up out of it substantially then we're probably in one of the moderately or very bullish counts. Falling out of the bottom of the channel may signify the end of the correction.


22:07 SPX Update - Moderately bullish count

Here's an updated count for one of the moderately bullish counts which puts us still in wave (ii) of [iii]. Its pretty much the same count off the low of 1042.17 as that shown in the bearish count in the last post, but here, I'd be looking for wave (C) to go higher, so the rally from where I have (B) of [Y] would be wave 1 of (C). Wave [Y] would be 1.618 x wave [W] at about 1109. Here's a 5 min chart:

21:22 SPX Update

Being bold here and marking a wave ii of (iii) high at today's highs. There are some nice fib relationships, as noted on the chart and we've retraced 70.70% of wave i. Obviously I have no idea if its a wave ii high or if there's more to go or if we're in one of the bullish counts posted below, but if it is a wave ii high, here's a 2 min chart showing how I would count it:


20:07 SPX Update

If we take out the high of wave 1 marked on the chart in the last post without making a new high first, then that may be wave (C) complete (I can adjust the labelling to show 5 waves up from where I have the wave (B) low). It would be quite short compared to wave (A). Currently, its only .382 x [A]. So, maybe then we'd need to be alert to the possibility that its only the first wave of (C) at today's high.


19:55 SPX Update

The market finally made its move. This is a possible count on the bearish side - putting us in wave (C) of [Y] to complete wave ii up - but bear in mind theother more bullish possibilities I listed in the 16;22 BST update. Here's a 1 min chart:


We are probably in wave 3 of (C), unless its going to extend, so at minimum, a wave 4 and 5 needed to finish it off.

18:10 SPX Update

The move down from today's high can be counted a number of ways at this time:

1) a (1),(2),1,2, with the second 2 being an expanded flat; or

2) a diagonal in progress for wave (1) or (A); or

3) a 5 wave impulse down to 1075.52 for (A), followed by a (B) wave and now in a diagonal for wave (C).

17:10 SPX update on option 1) from post at 16:22 BST

I forgot to mention that with regard to option 1) listed below, there are some possibilities within that:

a) We may still be in the process of completing wave (ii);or

b) we completed wave (ii) at the high of 1105.67 or 1103.95 and started wave (iii) down. We have seen wave i of (iii) and are currently in wave ii.

No wonder we're getting such wild swings most days - the market is as confused as we are!

16:40 SPX chart of option 5 listed in previous post

Here is an 8 min chart of option 5 listed in the update I posted at 16:22 BST:


Obviously, if we're in a 3rd of a 3rd as this count suggests, we'd really have to move up swiftly. Not doing so would cast doubt on this very bullish count.

16:35 SPX Chart of Option 4) in previous post

Here is a 20 min chart showing the count I listed as option 4) in the previous post:


16:22 SPX Options Update

There are various possibilities for where we are on the wave counts. These are the ones I am currently thinking of:

1) we're in a [i],[ii],(i),(ii),i,ii down from 1219; or

2) we completed wave [i] in 5 waves down from 1219 at the 1040.78 low (wave [iv] being unattractively outsized) and we are now retracing the whole of that drop in wave [ii]; or

3) we're in wave [iv] of a leading diagonal down from 1219.80. Wave [iv] must be a zig zag for this count to remain valid; or

4) we're completing an [X] wave from 1219.80 . We are still in [c] of a second zig zag down from 1219.80. Currently we are in (ii) of [c], so more downside to come before we rally above 1219.80; or 

5) we completed an [X] wave at the 1040.78 low. We then moved up in wave [i] and the low of 1042.17 was the end of wave [ii]. We are now moving up in wave [iii] of a minor wave A.

Here's a 60 min chart of SPX showing options 1) - 3) above:

15:53 SPX Update

This is the [A]-[B]-[C] count for wave ii of (iii) of [iii] referred to in the ES post below, shown on a 3 min chart of SPX:


We've retraced 61.8% of wave i so far and hit the downtrend line which represents the upper line on the leading diagonal count. Its difficult with these straight up opening moves to tell what the waves are, so if this is a [C] wave, there are reasons to think its complete (fib retrace level and fib relationship to [A]), but its really not possible to say for certain. Sometimes the market is like that!

15:15 ES update

Looks like the alternative on the bearish count, of an [X] wave at yesterday's lows ultimately won the day. Its possible to count a complete (A)-(B)-(C) for [Y] to finish ii up, but don't forget the more bullish counts shown yesterday, perhaps the least bullish of which is that we may still be in wave (ii).

It has to be said that the SPX doesn't look like a complete correction. It just looks like a single impulse up. However, if we count the move from 1042.17 as [A] up to yesterday's high and [B] down to yesterday's low, today's rally would be the [C] wave and, therefore, a simple impulse would complete wave ii.

Here's the ES chart:


Note: it can be counted as complete, but squiggles being what they are, don't be surprised if there is still another up leg to go.


11:42 S&P e mini futures

Looking at the ES on a 5 min chart, its a 70.70% retracement of the drop from yesterday's high. It counts nicely as three waves, so on the bearish count it would be (A)-(B)-(C) for wave [2] of iii of (iii).

However, it also counts as 5 waves up, perhaps for wave (A) of [Y] of ii, suggesting wave ii will retrace higher, or 3 waves for the first 3 waves of (A) of [Y] of ii.

There are UK and ECB interest rate decisions, plus job numbers to come before the open, so the picture could change substantially between now and then. Still, here's a 5 min chart of how it looks for now:


9.32 New Dollar page added

Click here or on the link menu link above

8.30 BST The Dax

The Dax has been strong of late. It nearly retraced the entire drop that occurred on the infamous "flash crash" in early May. But as a result, unlike most main indices that I follow, it can't be counted as 5 waves down from its high. Its either a [i],[ii],(i), ii) or a leading diagonal (but it has a long way to drop to qulaify as a leading diagonal - for its 5th wave to be longer then its 3rd wave, it needs to take out 5445 -ish - currently it is at 5930). Here is the [i],[ii],(i),(ii) count on a 60 min chart:


This is what it looks like on the 15 min chart:


The main count suggests that we should start [3] of i of (iii) down soon, but as you can see, there is an alternative that makes the recent low merely a wave x in an on going wave (ii) correction which would likely take out the recent high at 6114. I've marked a head and shoulders pattern on the chart which has a target of about 6054. If it fails now, having broken above the neckline, that would probably be very bearish.
 
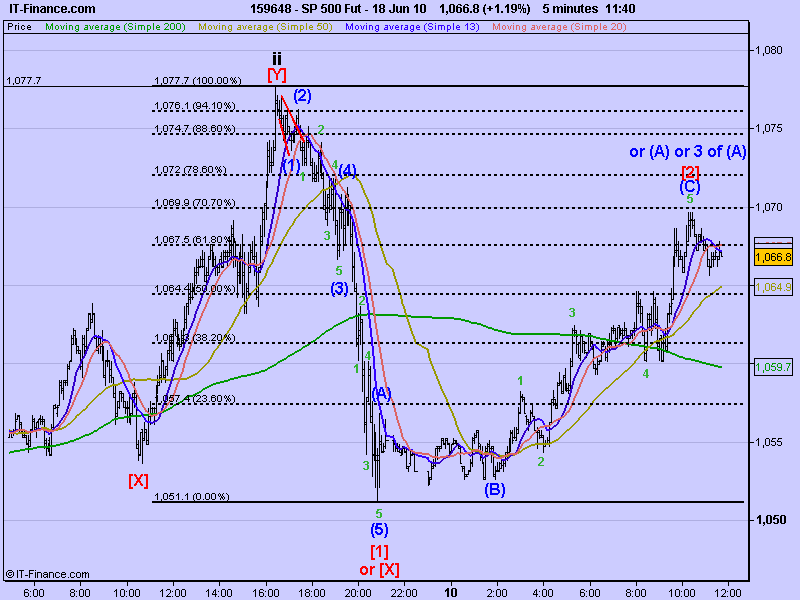
Finally, an even closer look on a 5 min chart: