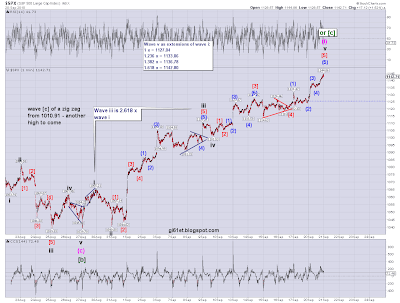
On the 3 bullish to bearish Options set out in Friday's end of day update, the wait for a top to the rally from the August low continues, as was the risk with the market failing to take out any significant level to the downside.
For the move off the August low I'm counting either a diagonal (ending or leading, depending on which of the Options you're looking at) or a 5 wave impulse. Please refer to the 60 min charts in Friday's end of day update for context (the following charts are based on the bearish count shown in Option 1 in that update).
Here's the ending diagonal count:
SPX 1 min - diagonal from August low:
This count suggests we're now in the final throes of the diagonal, assuming its not complete at today's high, whether you use the labels on this chart or the alternate labels shown on the chart below. It would be an ending diagonal for the bearish count shown in Option 1.
Here's a close up:
SPX 1 min - diagonal from August low close up:
Remember, the diagonal count I've labelled is invalid if this latest leg up exceeds 1150.84. To the downside, I'll be watching 1134.81, which would be a sign that the rally, if it was a diagonal, is over. However, I'd be a bit more confident that it had ended if we take out the low at 1123.97.
Still, with the bullish count shown shown as Option 3 in Friday's end of day update, there's always going to be a risk of further upside. On that count, this diagonal would be a leading diagonal. While we might expect a good retracement if it is, it would then be followed by new highs. This would be considerably less likely only if we take out 1039.70.
Here's the impulse wave count (these again use the count in Option 1 from Friday's end of day update, but assume that the rally from August is only wave (i) of [c] - I think that may now be unlikely and that its more probably all of [c] on this Option):
SPX 1 min - 5 wave impulse from August low:
Again, this is looking like it could be near completion, if not complete at today's high. You can see from the note on the chart that we've reached the point where wave v is a 1.618 extension of wave i in this rally. We've also reached the 61.8% retracement level of the decline from the April high.
Here's a close up:
SPX 1 min - 5 wave impulse from August low close up:
On this labelling, I'm looking at the low of 1119.77 as the level to watch for confirmation that a top is likely in. Until then, the 5 waves up that I've labelled from there could just be the first in a larger 5 wave move up.
However, even if we take out that level, given the bullish count (see Option 3 in Friday's end of day update) regard must be had to the continuing possibility of further highs - as mentioned above, we'd have to take out the low at 1039.70 to start to think that the bullish option may not be playing out.
So, those are the levels I'm watching on the labelling I've applied to the move from the August low. Since a decline would be due whether the bullish or bearish Options are playing out, it can't be assumed that a top is the end of any further upside. As stated in previous updates, until we see price action which is consistent with a major top having been made, in one of the bearish Options (1 or 2 in Friday's end of day update) and which takes out significant levels, the risk remains to the upside.


