
Still no resolution yet to the question whether we're in a deep 2nd wave retracement of the decline from 1131.23 or a shallower 2nd wave retracement of the decline from 1082.60 or a 4th wave retracement or something more bullish that will take us back above 1131.23.
Remember, the Options listed below are the different ways to count the move down from 1219.80. There are 5 that I'm following and they are set out on the 60 min counts page.
On the chart of each Option I have labelled one of the 4 Counts (numbered 1,2,4 and 5) that I'm following for the decline from 1131.23. Each of these Counts could apply to any one of the Options, though what they mean may differ depending on which Option you are looking at.
Here's how things stand after today:
Option 1 - Wave (ii) of [iii] topped at 1131.23
7 min chart:

I've applied Count 1 to the chart of this Option. It assumes that we completed 5 waves down from 1131.23 at the low of 1010.91. From that low, I've labelled an incomplete double zig zag. It assumes we've completed the first zig zag in a double zig zag at today's high. We are now in an [X] wave before the next leg of the rally to complete the 2nd wave. It will probably have to be a zig zag in order to retrace a decent amount of the drop from 1131.23.
This Count is invalidated below 1010.91. If that happens, then one of the other Counts, 2, 4 or 5, is in operation and we have not yet completed 5 waves down from 1131.23.
Option 2 - Wave [ii] topped at 1131.23
7 min chart:

This is Count 2 which has us in the 5th wave of a 5 wave drop from 1131.23 extending.
The low of 1010.91 is labelled as the 3rd wave of the 5th wave and today's high is labelled as the 4th wave. I've labelled the decline from today's high as part of the 5th wave which will complete 5 waves down from 1131.23.
The Count as labelled will be invalidated above 1042.50. In that event, I'll look to the incomplete double zig zag count I was following today and expect a deeper wave [4] retracement.
Option 3 - Wave [iv] of an ending diagonal completed at 1131.23
7 min chart:

I've also applied Count 2 to the chart of this Option. So, we have started the 5th wave down to complete 5 waves down from 1131.23. Again, the Count as labelled is invalidated above 1042.50. Remember that for this Option to remain valid, we need to stay above 999.83 for the 5th wave of the leading diagonal.
The bullish alternative, that we bottomed in wave [v] of a leading diagonal down from 1219.80 at the low of 1010.91 low remains. It will only be invalidated if we drop below 1010.91.

The bullish alternative, that we bottomed in wave [v] of a leading diagonal down from 1219.80 at the low of 1010.91 low remains. It will only be invalidated if we drop below 1010.91.
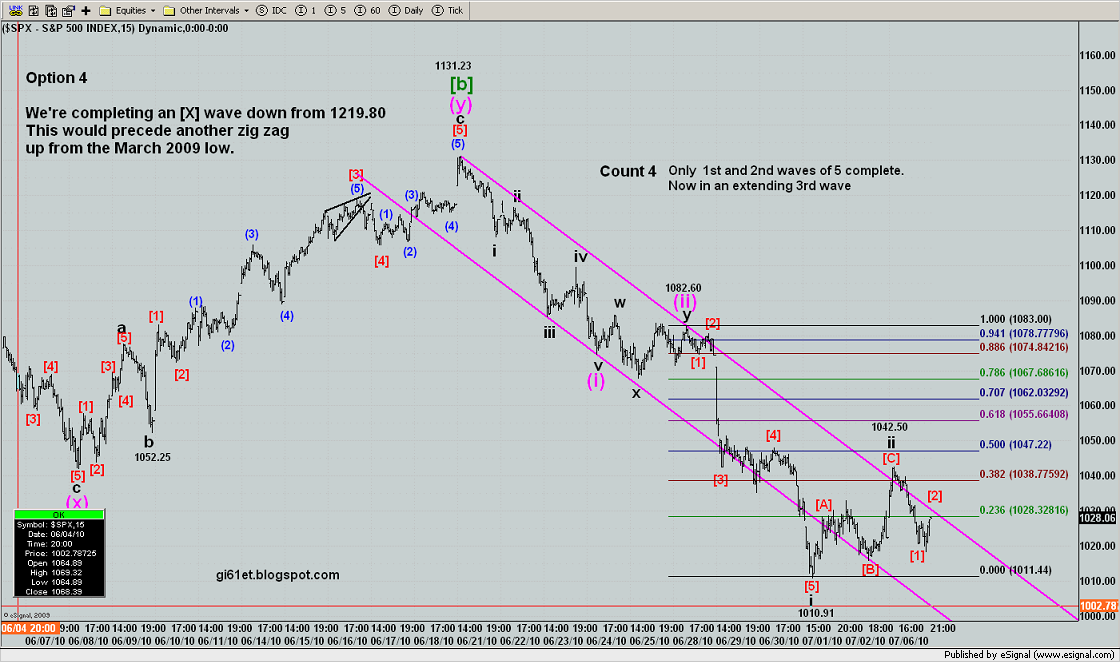
Option 4 - Wave [b] of minor Y within intermediate [X] topped at 1131.23
15 min chart:

I've applied Count 4 to the chart of this Option. It puts us in an extending 3rd wave down from 1131.23. I've marked today's high as the end of wave ii of (iii), but it could have more to go if we are seeing an incomplete double zig zag from 1010.91.
The Count as labelled is invalidated above 1042.50 and if that happens, I'll switch focus to the incomplete double zig zag count and look for a deeper retracement in wave ii of (iii).
The retracement can't exceed 1082.60 if this count is correct.
Option 5 - Minor wave X within intermediate wave [X] topped at 1131.23. Now in minor Y down
8 min chart:

On the chart of this Option I've applied Count 5 which puts us in an extending 3rd wave off the 1131.23 high, but we'd be further along into it than under Count 4 shown on the chart of Option 4 above - we'd be into wave v of (iii) now, if we topped in wave iv at today's high.

On the chart of this Option I've applied Count 5 which puts us in an extending 3rd wave off the 1131.23 high, but we'd be further along into it than under Count 4 shown on the chart of Option 4 above - we'd be into wave v of (iii) now, if we topped in wave iv at today's high.
The Count as labelled is invalid above 1042.50 and provided we stay above 1010.91, the incomplete double zig zag count will come into effect.
For completeness, here are the two charts I was following today, which label the move from 1010.91, one showing a double zig zag complete at 1042.50 and the other showing a double zig zag still in progress:
Double zig zag complete:

On-going double zig zag:
