Menu

Thursday, 21 October 2010

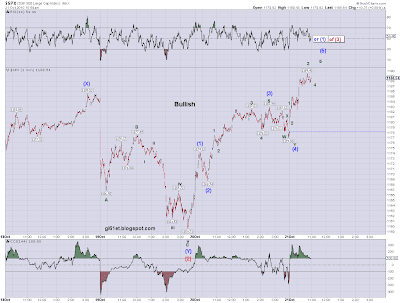
21:21 BST - SPX: 60 min counts page updated, plus a close up of the potential ending diagonal count

I've updated the charts on the 60 min counts page. Option 2 now shows the ending diagonal count I mentioned in the end of day update. If the bearish count shown in Charts 1 and 2 of the end of day update is invalidated, the ending diagonal will become my preferred count.

Here's a close up from the wave iv low at 1131.81:

SPX 1 min - close up of ending diagonal count:


As mentioned in the end of day update, assuming this labelling is correct, wave [5] of the diagonal must stay below 1200.89. However, under the rules, it has to take out the high of wave iii at 1189.43.

If things are really going to drag on, we may still in fact be in wave [3] of the diagonal. If this is the case, wave [4] will have to stay above the dotted blue line I've sketched in, otherwise the lines of the diagonal will no longer converge and it will no longer qualify as a diagonal.

21:18 BST - SPX End of Day Update

Here' the bigger picture for the bearish count:

Chart 1: SPX 60 min - bearish count:


It shows a possible complete 5 waves up from the August low at today's high.

Here's a close up from the high at wave (iii):

Chart 2: SPX 1 min - bearish count close up:


The decline from the high started off well, but with the late rally, we're left with a (1)-(2)-1-2 count that doesn't look pretty at all.

For it to survive, we have to stay below 1181.90 in wave 2 of (3).

If we take that out, its going to look like the alternate is playing out, so there'd be more upside to come. This alternate can only be ruled out if we drop below 1159.71.

Another, possibly less bullish alternate is shown on the 60 min chart of the bullish count below - a possible diagonal for wave (v).

Here's the bigger picture for the bullish count:

Chart 3: SPX 60 min - bullish count:


This shows a sub-dividing wave (v) in a continuing 5 wave move up from the August low. This would be very bullish.

Note the alternate that I've sketched in, a possible ending diagonal for wave (v), with only the 5th wave of the diagonal to come. If the 4th wave was today's low at 1171.17, the 5th wave would have to stay below 1200.89 in order to remain shorter than the 3rd wave. So, this would certainly be a less bullish count than the main count labelled.

Here's a close up from the wave (X) of [2] high:

Chart 4: SPX 1 min - bullish count close up:


It would probably look odd if we take out 1171.17 at this stage, but it wouldn't invalidate the overall count. To do that, we need to take out the low at 1159.71.

So, its nice and simple - taking out 1181.90 calls the bear count into question and will probably cause it to revert back to a bullish count using the alternate labelling shown on Chart 2 above or the diagonal shown in Chart 3 above.

Taking out 1171.17 will raise questions concern on the bullish count but won't eliminate it. Taking out 1159.71 will rule it out.

18:57 BST - SPX Update

What was the moderately bullish count I've now re-named the bearish count. Here's what I'm seeing currently:

SPX 1 min - bearish count:


Be warned - as I said earlier, until we take out 1159.71, there's a risk that we only saw wave i of (v) at today's high, in which case, this count would revert to bullish.

Taking out the high at1181.90 at this stage is going to cause concern on this bear count.

Here's the bullish count:

SPX 1 min - bullish count:


The decline could be forming an A-B-C or it could be a W-X-Y, with W at the low of 1178.42. We have to stay above 1159.71 to keep this ocunt on the table.

16:34 BST - SPX Update

Well, its possible that we've seen 5 waves up from 1159.71. Here it is on the moderately bullish count:

SPX 1 min - moderately bullish count close up:


We have what looks like 5 waves down from today's high - now we need to see any retracement stay below that high.

Until we take out the 1159.71 low, however, the risk of further upside remains since we could just have seen wave i of (v) complete at today's high. Taking out the 1159.71 low would eliminate this possibility.

16:02 BST - SPX Update

With the new high today, the immediately bearish count in Charts 1 and 2 of yesterday's end of day update has been eliminated, leaving the moderately bullish and bullish counts.

Here's the moderately bullish count, the bigger picture for which was shown in Chart 3 in yesterday's end of day update:

SPX 1 min - moderately bullish count close up:


Its possible that we've got 5 waves from the wave (iv) low to today's high, but you can see that I've allowed for another dip and rally. If we were to take out 1177.00, I'd be thinking that the 5 waves that could be wave (v) had completed, but I'd then want to see a swift decline taking out the wave (iv) low.

Here's the more bullish count updating Charts 4 and 5 from yesterday's end of day update:

SPX 1 min - very bullish count close up:


Here too, we may have topped in 5 waves up from the wave [2] low, but I've allowed for another rally.

If we have topped or nearly topped, then the alternate labelling of this rally from the wave [2] low will be more appropriate, making that rally only wave (1) of [3].

Dropping below the wave [2] low at 1159.71 would invalidate this count. While we're above that level, further upside should be expected.