Menu

Monday 9 August 2010

21:23 BST - SPX UPdate

The Options referred to below are different ways to count the move down from 1219.80 to 1010.91 and you can see them on the 60 min counts page, which will put the charts below into context.

The 10 min charts below show various ways to count the rally from the 1010.91 low on 1 July in the context of the larger picture shown on those 60 min charts.

On the charts of Options 1 and 2, I'm showing a single zig zag. On the chart of Option 3, there is a triple zig zag,  on the chart of Option 4 there's a double zig zag and on the chart of Option 5, there is a single zig zag with an ending diagonal for wave (c).

Here are the 10 min charts:

Options 1 and 2 - from 1010.91, a double zig zag:


I'm only showing the 10 min chart of Option 2 since the counts are now the same under both these Options, namely, a single zig zag which is complete at 1129.24 or nearly complete. Here's a more zoomed in look:

SPX 1 min - top of wave a, wave b and wave c of a single zig zag:


And here's the close up chart I was posting today showing the possibility that we may have topped at 1129.42:

SPX 1 min from 1126.03 high:


Taking out 1120.91, the wave (4) low, would be the first sign that the zig zag is complete. After that, taking out 1107.17 would be the next level to watch to gain confidence in a top. However, taking out 1088.01 would provide a higher degree of confidence since that would avoid the possibility of an extending [C] wave, where 1129.24 was only the 1st wave within the 5 waves required for wave [C]. Until we take out that level, the risk of further upside remains.

Option 3 - from 1010.91, a triple zig zag:


This too, can count as complete at 1129.24 or nearly complete. I think that, as with the single zig zag under Options 1 and 2, a drop below 1120.91 would be an initial sign of a possible top, but we need to take out 1107.17 to gain confidence in thinking that the triple zig zag might be over. That avoids a possible extending (c) wave. However, taking out 1088.01 would increase confidence in a top considerably. Taking out that lower level would avoid the possibility that it was only wave (a) of the third zig zag that topped at 1129.24.

Option 4 - from 1010.91, a double zig zag:


From the low at 1088.01, the count on this chart is the same as the count from that level under Options 1 and 2, so the same comments apply here.

Don't forget the bullish alternative count (see under the 60 min counts page for the bigger picture).

Here it is on a 1 min chart:

SPX 1 min - Option 4, bullish alternative count:


Given the number of ones and twos appearing here, its possible its really a leading diagonal from the 1010.91 low and the high at 1129.24 could be the completion of it. If so, or if it is nearly complete, I would count it as wave [i] of A and we should see a decent retracement in wave [ii] before a wave [iii] kicks off. Obviously, any wave [ii] retracement must stay above 1010.91 for this count to remain valid.

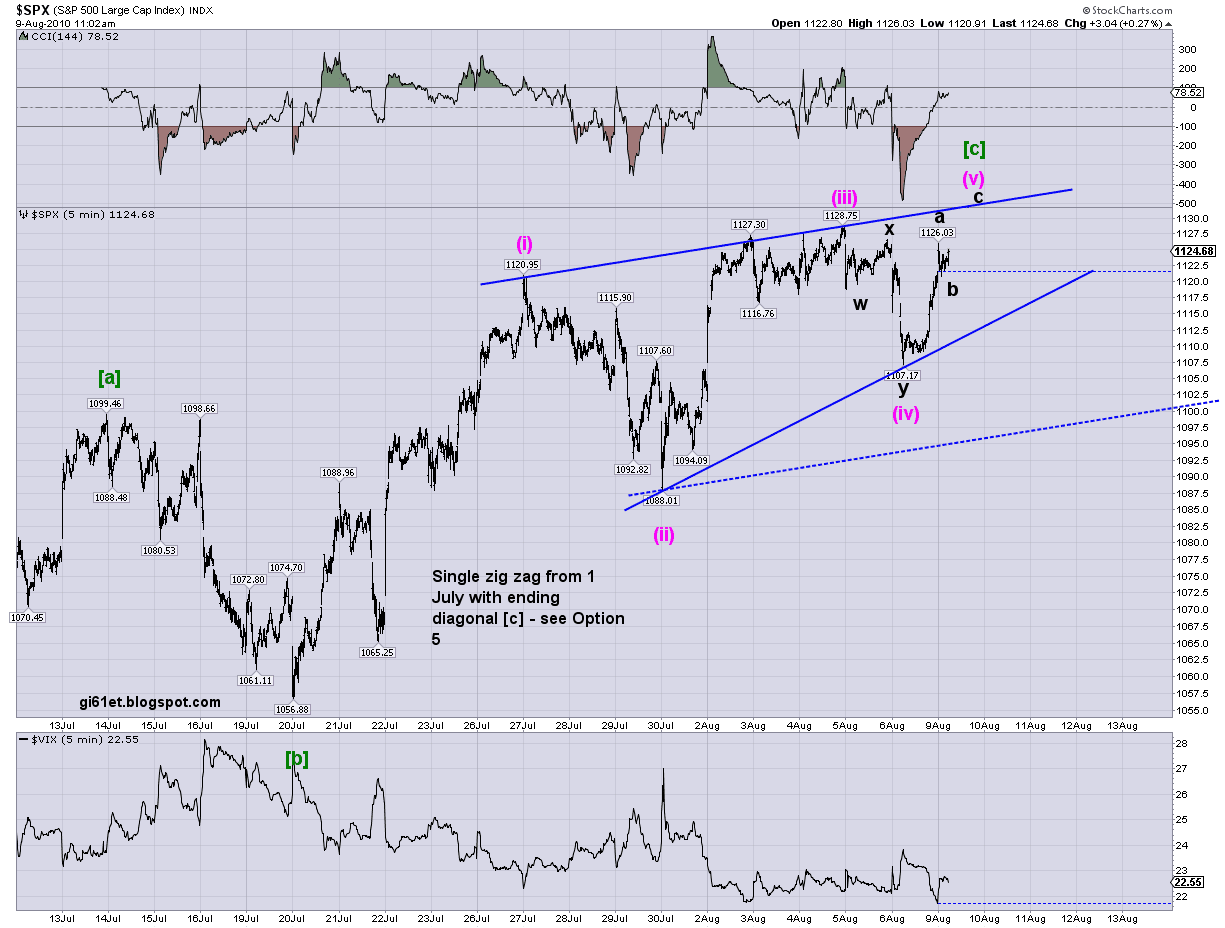
Option 5 - from 1010.91, a single zig zag with an ending diagonal for wave (c):


From what is labelled as the wave (iv) low of the ending diagonal at 1107.17, I can count a zig zag up to the high at 1129.24. The wave a of (v) high would be at 1127.01 and the wave b of (v) low would be at 1124.92. From there its possible to count 5 waves up, but we can't rule out more upside to come, given that wave c of (v) does look a little stunted.

However, so far, the requirements for an ending diagonal have been met - wave (v) can be counted as a zig zag, its moved beyond the high of wave (iii) of the diagonal at 1128.75 and its shorter than wave (iii), having not (so far at least) exceeded 1147.91.

So, while the trend is still up and we have to go with that, there are reasons to be on the look out for a top around here.
I don't think we can really start to have confidence in a top on this count until we take out 1107.17. That is now the level to watch on this count to confirm a top under this Option.


19:50 BST - SPX Update

OK, no truncated top! But we might be fairly close to a top if 1127.01 was wave 3 of (5) and we are now in wave 5 of (5), as shown as an alternative on this close up of today's action:

SPX 1 min from 1126.03:


However, again, with the trend up, assume more upside to come before we can count a top. Taking out 1124.24 in an assumed wave 4 of (5) increases the chance that the alternate is playing out.

19:28 BST - SPX Update

Here's one of the charts I showed earlier which suggested more upside to come to complete a correction from the 1 July low. Its the chart of the single zig zag I have on the 60 min Option 2 chart which had Friday's low as a 4th wave within the c wave of the zig zag:

SPX 1 min - single zig zag, c wave in progress:


It looks like we're into that 5th wave now, looking for a high somewhere above 1128.75.

I mentioned in Friday night's late update the possibility that we might not get much above that level or might even truncate. Here's a close up of today's action which shows a count for a new high in the works, but also shows how we may already have topped with a truncation:

SPX 1 min close up from 1126.03:


The blue dotted lines show a possible triangle for wave (4) and 5 waves up from there to 1127.01. That could be our 5th wave ending in a truncated top. It would mean counting a small leading diagonal down for the first leg down of a larger downtrend, as shown by the dotted red lines.

Obviously, taking out today's high would invalidate this truncated top possibility, but if we don't take it out, it doesn't look too bad.

For the moment, however, since the overall trend is still really up, its safer to assume that we will make a new high. But, if before doing so, we take out 1124.24 or, better still, 1122.57 or 1120.91, the odds start increasing that we may already have seen a truncated top at 1127.01.


16:32 BST - SPX Update

The counts showing a top to a corrective move up since the 1 July low  (see the Option 1 and 4 charts in the last post) are very close to being invalidated or rendered highly unlikely - taking out 1126.56 will do it.

It may be more likely that today's action is a 4th or b wave (see the charts of Options 2, 3 and 5 in the last post). 

We've had what looks like 5 waves down from today's high and a sideways to up move since. This could be a completed 4th or b wave, so we may just have started the next leg up, or we may still have a drop to come to complete either of those. If today's high can remain intact, it could be a (1)-(2) down.

Here's a possible count for today's action:

SPX 1 min - count from 1126.03:


So, for the moment, all counts are still on the table and we just have to wait and see and watch those levels previously indentified.

16:05 BST - SPX Update

Here are some of the counts that I showed on Friday, updated with today's action. Please refer to the updated 60 min counts page for the context of each (I've related each of the short term counts shown here to those 6o min charts):

SPX 1 min - single zig zag complete at 1128.75:


This relates to the Option 1 60 min chart. The [1]-[2]-(1)-(2) held, but only just. We need to stay below 1126.56 and start to drop impulsively.

SPX 1 min - single zig zag still in 5th wave of [c]:


This relates to the Option 2 60 min chart. We need to stay above 1112.06 if we are in wave (iv) of [5], otherwise, this labelling is invalidated. If we take out 1107.17, it may well be that the overall count is invalid.

SPX 1 min - triple zig zag with wave (c) of the final zig zag in progress:


This relates to the Option 3 60 min chart. 

Again, the labelling is invalid if we take out 1112.06 without a new high. However, we may simply still be in wave (b). A drop below 1088.01 increases the likelihood that we're not in this count or that it completed at 1128.56 or 1126.56 (see the counts shown in the secoond and third charts I posted in the 21:49 update on Friday which count a top into either of those two levels).

SPX 1 min - double zig zag complete at 1126.56:


This relates to the Option 4 60 min chart. However, please note that it may be incomplete - its really the same as the alternatives shown in the first two charts above for the single zig zag.

SPX 5 min - single zig zag with ending diagonal (c) wave in progress:


This relates to the 60 min chart of Option 5.

Wave (v) must be a zig zag, must make a new high above 1128.75 and must stay under 1147.91. Moving to the blue dotted line before a new high will invalidate the diagonal.