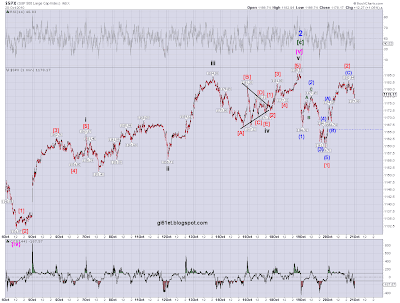
You'll see from the 60 min counts page that 5 waves up from the August low is what I'm looking for on all three Options shown, from the very bearish through to the very bullish. What 5 waves up from that low means will depend on which of those Options is playing out. To determine that, we'll have to wait and see what sort of decline we get once we actually see a top to the rally, if we haven't already seen it.
In the meantime, here's the bearish count which assumes a top at 1185.53 (you can see the bigger picture of this count on the 60 min counts page):
Chart 1: SPX 1 min - 5 waves up from August low complete:
Obviously, we can't now move above the high at 1185.53 if the main labelling is correct.
Obviously, we can't now move above the high at 1185.53 if the main labelling is correct.
Here's a closer look:
Chart 2: SPX 1 min - 5 waves up from August low close up:
If this count is correct, we need to see an impulsive decline which, so far, we haven't see. Until we do see that, the risk remains to the upside.
If we take out the high at 1185.53, it doesn't necessarily mean that there is a great deal more upside to come in the bullish count I've been showing which puts us in a sub-dividing wave (v). Here's a count which assumes a further high to come, but probably not too much higher:
Chart 3 - 60 min alternate bearish count:
We only need 5 waves up from the low labelled (iv) to complete this count and you'll see from the count in Chart 4 below that we could be close to getting that after a wave (4) correction. So, provided wave (v) on the above count doesn't extened, a top on this count may not be far off.
Here's the more bullish count:
Here's the more bullish count:
Chart 4 : SPX 1 min - wave (v) up from August low still in progress:
On the labelling shown, a drop below 1155.71 would invalidate this count since wave [2] of iii can't drop below the start of wave [1] of iii. As long as we remain above that low, however, the risk of further upside remains. However, falling below 1168.74 would, in my view weaken this count considerably and taking out 1159.71 at this stage would make me really start to question it.
Here it is close up:
Chart 5: SPX 1 min - bullish count close up:
Taking out the high at 1174.13 in an assumed wave (4) would invalidate the main labelling. Taking out the low at 1168.74 invalidates the alternate labelling and will begin to focus attention on the bearish count.
So, the levels I'm watching on the counts that I've labelled are 1185.53 (which has to hold if a top for the rally from the August low is in), 1174.13 (moving below which would rule out the main bullish count on Charts 4 and 5 above) and 1168.74 (taking that out would rule out the alternate bullish count shown on Charts 4 and 5).
Then there are the 1159.71 and 1155.71 levels to watch. If we take those out, the very bullish count would start to lose credibility and then be invalidated, respectively. Ironically, such a move would be OK as a continuing wave (iv) correction on the alternate bearish count shown on Chart 3 above, so we'd still have the risk of a further high to come on that count.
Then there are the 1159.71 and 1155.71 levels to watch. If we take those out, the very bullish count would start to lose credibility and then be invalidated, respectively. Ironically, such a move would be OK as a continuing wave (iv) correction on the alternate bearish count shown on Chart 3 above, so we'd still have the risk of a further high to come on that count.


