Menu

Thursday, 12 August 2010

11:50 BST - SPX Daily Chart Update

Yesterday I posted a 60 min chart of SPX which showed that the bearish signs that had been appearing on it since around the end of July (click here to see how it looked at the end of July) based on standard technical analysis had finally manifested themselves in price action.

Here's the daily version of that chart:

SPX Daily pitchforks:


You can find the last posting of this chart on 7 August by clicking here. I've left most of the comments on the chart as they were at the time I last posted it since they set out the issues that there seemed to be against the bullish case and which may now be playing out in price action with yesterday's decline.

Since I last posted it, those bearish signs have got worse, so the bearish case seems to be asserting itslef against the bulish signs that were mentioned in my 7 August post:

1) the CCI has made a definite turn down from the zero line (the failure to get above it despite the undoubted extent of the rally in July seems very bearish);

2) price, which had resumed its crawl up the lower line of the blue fork and appeared to be trying to make it to the midline of the upward dark green fork, has now completely backed off both. The failure of price to get to the midline of the dark green fork during the last push up which resulted in the choppy sideways action we saw earlier this month was a sign of weakness (I mentioned this in the 7 August post). Price is now coming down to the lower line of the dark green fork and the midline of the downward red fork. If we're going to get follow through to the bearish case, those will be broken to the downside. Otherwise, we could be in for more choppy action;

3) the MACD histogram, which had been diverging bearishly against price  for some time, went negative yesterday signifying a bearish cross in the MACD itself. The similarity between the behaviour of these two indicators now and what they did prior to the April top remains: the histogram diverging against price while the MACD itself rose, suggesting underlying weakness despite the rising MACD line;

4) the RSI, having continued to fail to get to the bullish level of 66.67, has now fallen back below 50, possibly confirming that the July rally was countertrend. Really though, we want to see the RSI get to the bearish level of 33.33 and stay down there if the bearish case is to play out;

5) the stochastic has a triple top in place.

Despite yesterday's large decline, the indicators suggest there is alot more room to the downside - this may well be confirmation that its the bearish counts that we should see play out over the next few weeks. 

However,  remember that bullish counts remain on the table. The main one I have isn't invalidated until we drop below 1010.91 - see last night's update for more detail and the links to which it refers.  So really, for the bearish case, we're going to want to see price take out that level before the indicators start to show bottoming signs or even bullish signs ( I should also mention that the bear case is not sealed even if we drop below 1010.91 - you can see from the chart on the "Impulse from March 2009" page and the alternative counts on the charts on the "Zig zag from March 2009" page that those ultimately bullish counts are not eliminated by taking out that level).

Of course, it may be too much to expect a straight line drop even if the bearish case is playing out. As mentioned in my post of the 60 min version of this chart yesterday, there are signs that we should at least be prepared to see a bounce of some sort. The current elliott wave counts would tend to support this as you can see from last night's update, though its feasible that we decline more before a proper retracement. As mentioned in one of my 1 min chart updates yesterday, if yesterday's drop is wave [3], it would be a 2.618 extension of wave [1] at about 1081. At the moment that wave is somewhere between the 1.618 and 2.618 extension levels. It would be nice and neat of we could get to the latter. 

When we do get a bounce, we'll need to monitor it to see if we can get an early warning that it might be something more bullish than a normal retracement in a downtrend. I identified some levels to watch in last night's update which might help on this, assuming the count shown is correct.

So, we had a nice decline yesterday which has given some credence to the bearish case. However, with bullish possibilities still very much alive, this is no time for complacency on the bearish side (not that there is ever a time for complacency in the market). Trading is a process of continually monitoring and adjusting as price action develops and not taking anything for granted.


Wednesday, 11 August 2010

21:41 BST - SPX Update

The Options referred to below are different ways to count the move down from 1219.80 to 1010.91 and you can see them on the 60 min counts page, which will put the charts below into context.

The 10 min charts below show various ways to count the rally from the 1010.91 low on 1 July in the context of the larger picture shown on those 60 min charts.

On the charts of Options 1 and 2, I'm showing a single zig zag. On the chart of Option 3, there is a triple zig zag,  on the chart of Option 4 there's a double zig zag and on the chart of Option 5, there is a single zig zag with an ending diagonal for wave (c).

Here are the 10 min charts:

Options 1 and 2 - from 1010.91, a double zig zag:


I'm still only showing the 10 min chart of Option 2 since the counts are now the same under both these Options, namely, a single zig zag which is complete at 1129.24. Here's a more zoomed in look on the 1 min chart I've been posting:

SPX 1 min:


I've amended the labelling slightly from earlier, but overall, the bearish count I showed at the end of yesterday seems to be playing out, so far.

We've taken out three of the levels I mentioned in last night's update, so excluded the near term bullish counts that remained while those levels were intact. 
However, for the moment, the main level I was watching, 1088.01, remains - but only just.  Taking out 1088.01 would provide a higher degree of confidence in a top since that's the last low that has to survive if wave c is going to extend. on this labelling.
If the labels on the 1 min chart above are correct however, we should take out 1088.01 very soon.

However, taking it out doesn't mean we can assume that  its all down from here. There are still bullish counts on the table - see under Option 4 below. So we just need to keep monitoring important levels as the price action develops to try and get an early warning that a bullish count is more likely to be playing out and that this count is wrong.

On the labelling in the 1 min chart above, if we have completed or nearly completed wave [3] down, the next retracement would be wave [4]. Wave [4] cannot end above the wave [1] low at 1111.58, so, if we retrace up to that level in an assumed wave [4], that may well be an early warning that something is amiss with the bearish count.

It won't be conclusive, because we could be in the [1]-[2]-(1) count I had on the 1 min chart earlier, with wave (1) of [3] being the wave that is complete or nearly complete. In that case, we could retrace all the way back up to 1127.16 and the bearish count could stand -it wouldn't be very pretty and I think if we were to get such a retracement, we'd have to be very cautious of the risk that the action was telling us that the bearish count is not in play.

Nevertheless, from an elliott wave stand point, 1111.58 and 1127.16 are the levels to watch to the upside.

To the downside,  the level we need to take out to dismiss the bullish count shown below is 1010.91.

Option 3 - from 1010.91, a triple zig zag:


This too, can count as complete at 1129.24 and that's how I've labelled it for the time being. Of course, 1129.24 must remain intact if that is the case.

The count from the high at 1129.24 is the same as shown under Options 1 and 2 above, so please refer to the 1 min chart posted above and the comments there about the levels to watch.

Option 4 - from 1010.91, a double zig zag:


This double zig zag can also count as complete at the 1129.24 high. The count from there is the  same as the count from that level under Options 1 and 2, so the comments made there apply here also.


Here it is on a 1 min chart:

SPX 1 min - Option 4, bullish alternative count:


Technically this remains valid as labelled since we haven't taken out the 1088.01 low. However, it may be more likely that wave (ii) is forming an expanded flat as mentioned in my earlier post today, or that we have seen a leading diagonal up from the July low as shown in this chart which I've updated from that earlier post:

SPX 60 min - bullish alternative leading diagonal wave A:


You can see that I've labelled the 1129.24 high as wave A, but it could be wave [i] of A.  Whatever it is, the retracement could be almost done as a zig zag.  However, a normal retracement of a diagonal is considered to be 78.6% - that would take us down to about 1036. Having said that,  in elliott wave terms, once we can count 5 waves down from the high that I've labelled (b) of B, we should be on alert for a rally back up in C or [iii] of A, regardless of whether or not we have reached the 78.6% retracement.

Obviously, any retracement must stay above 1010.91 for this count to remain valid.

Option 5 - from 1010.91, a single zig zag with an ending diagonal for wave (c):


A complete ending diagonal can be counted into the high at 1129.24. I've labelled it as such. Taking out 1107.17 today has precluded the possibility of a continuing wave v.

So, the count down from 1129.24 is the same as for Options 1 and 2 so please refer to the 1 min chart and the commentary there as they apply here also.


19:45 BST - SPX Update - 60 min chart

This is the 60 min chart I've been posting since 30 July highlighting bearish signs that seemed to be appearing, warning of a potential end to the rally from the 1 July low (you'll find the most recent posting of it here) :

SPX 60 min:


These bearish signs seem finally to have played out in price action. 

However, you'll see that we've now come down to the bottom of the first area of support at 1088 which is also the lower line of the downward purple pitchfork  and the 200ma - not surprising then, with such a confluence of  support areas that today's down move has been stalling in this area for a couple of hours.

The indicators may be signalling a bounce could be due - you can see them highlighted by yellow circles: the RSI is at 30 and looking like it might turn up; the MACD histogram looks like the latest two bars have formed   higher lows; and the Slow Sto looks like its curling up from oversold levels.

These aren't necessarily buy signals (if tempted to have a punt on the long side, I'd drill down to a much smaller timeframe to find an entry with a tight stop), just perhaps warnings to be prepared for a bounce while these indicators work off their currently oversold conditions. If things are extremely bearish, they'll do that without much of a bounce in price, but its quite possible that they just stay oversold and price continues to tumble.

For the moment at least, price action and internals suggest that long positions are risky. Of course, in recent weeks, things have had a habit of turning around sharply just when it looked like a new downtrend had begun, so we can't rule out a sudden turn around. 

When we do get a bounce,  much will depend on the way it behaves - if looking for further downside, we don't want any bounce to look too impulsive. Of course, any corrective bounce needs to be in 3 waves  and preferably, if today's low is wave (1) of [3], a bounce will not get too much above the 61.8% retracement level at around 1113. If its wave [4], then it has to stay below 1111.58 (the wave [1] low) and preferably it should stay around the 38.2% retracement level at about 1103.

Three wave bounces into these areas may be worth shorting given the internals, but of course, stops are vital in case the bounce turns into something more bullish. Of course, these levels will change if we drop further before any significant bounce, but you get the idea.


17:14 BST - SPX Update - the bullish count

The bullish case is down, but not out at the moment. The main bullish count that could lead to new highs above 1219.80 is explained under Option 4 on the 60 min counts page and shown  close up in last night's update. Here's how the count shown in last night's update looks at the moment - I've updated it to take account of today's decline:

SPX 1 min - bullish alternative under Option 4:


If we take out 1088.01, this [i]-[ii]-(i)-(ii)-i-ii count is out. We could still be in an expanded flat wave (ii) however - that would only be invalidated below 1056.88.

If we were to take out 1056.88 as well (perhaps not today!), then this bullish alternative would need to be adjusted to the leading diagonal possibility I referred to last night, which always has to be considered when you see what might look like a series of ones and twos. Here it is on a 60 min chart:

SPX 60 min - bullish alternative under Option 4: leading diagonal:


As noted in last night's update, this count would stand until we take out 1010.91, so the bearish case could still disappoint until that level goes.

You'll see from the chart that the leading diagonal could be all of wave A of the third zig zag from the March 2009 low (see the alternative count on the second chart on the "Zig Zag from March 2009" page for the bigger picture), or it could just be wave [i] of A. The latter would obviously be very much more bullish.

The bad news for the bears is that even if we take out 1010.91, it doesn't mean we're on our way to zero. You'll see from the page entitled "Impulse from March 2009" that the count shown there can accommodate a decline below the 1010.91 low in a wave (2). This is something to be on guard for because if we take out 1010.91 and it turns out that this is the correct count, it could catch alot of shorts on the wrong side.

16:42 BST - SPX Update

Here's an update of the 1 min chart posted earlier:

SPX 1 min:


I'm showing a completed wave (1) of [3] down, but this could be wave [3] itself - its done enough to count as wave [3] and has left enough room for a wave [4] correction which doesn't have too much risk of overlapping wave [1].  

I'm not sure yet which to favour but if we take out 1111.58 (wave [1] low) today's low can't have been wave [3] and its more likely its wave (1) of [3] as suggested by the main labelling.

Obviously, there's a possibility that we still haven't bottomed, but it can be counted as a complete 5 waves down from 1126.16, so that's what I've gone with for the moment.

If we haven't yet bottomed, the drop from 1126.16 would be a 2.618 extension of the drop from 1129.24 to 1111.58 at about 1081. If we drop that low without a retracement first, I'd be more inclined to count the drop from 1126.16 as wave [3].


15:16 BST - SPX Update - 1 min chart

For the bearish counts which have us having topped at 1129.24, here's the 1 min chart I posted yesterday brought up to date with today's drop. I've amended the degrees for the decline from 1127.16 to show us in only wave (1) of [3] at the moment. If its right we're possibly in wave 4 of (1) (but we could still be in wave 3). If we're in wave 4, I've shown the retracement levels and, of course, we can't end wave 4 above 1119.42:

SPX 1 min:


Of course, its not impossible that today's low is wave [3] and we now go sideways in wave [4] - if this is playing out, we can't exceed the wave [1] low at 1111.58.

Please also remember that bullish possibilities remain until we drop below 1088.01 - see last night's post for details.

11:36 BST - Dax Update - Possible top in the Dax?

In my last post on the Dax, there seemed to be a possibility that a top could be near, although it was by no means certain. Since then, we did make another new high, as was expected under the elliott wave count, but it was not much higher than where we were at the time of that last post.

In the light of subsequent action, I've relabelled the 15 min chart to show a straight impulse wave up from the minor B wave low at 5906.04 to the current high at 6386.97. Please refer to the previous post for the daily charts and a wider view of the 15 min chart - the one below zooms in to look at the move from the minor B low:

Dax 15 min:


You can see that from the current high at 6386.97, there appears to be 5 waves down, followed by what has to be a corrective retracement up to 6356.41 (since its now dropped below the low from which it started).

At the moment, this could just be a correction of the rally from the minor B low if wave C is extending or if the bullish alternative I referred to in the previous post is playing out, where that low is wave (X) preceding another zig zag up.  In this case, the high at 6386.97 could be  [i] of C or it could be minor A up or just [i] of A.

As I mentioned in that last post, assuming that wave B, or (X) on the bullish count, was a triangle as shown, we need to drop below the end of the triangle at 5906.04 in order to avoid the rally from there being only part of minor C on the bearish count or all or part of minor A up on the bullish count.

Until we take out that low, the risk of a larger C wave on the bearish count and the bullish count remain on the table.

Assuming we've topped, if we're in wave [3] of iii down on the bearish count, as my labelling speculates, a wave [4] of iii retracement must not end above the wave [1] of iii low at 6275.32. Taking that out on an assumed wave [4] will be a sign that this count may be wrong and that wave C is extending or that the bullish count may be taking hold.

If we get [4] and [5] down to complete wave iii, I'll then be watching the wave i low at 6244.69, since a wave iv retracement must not end above that level.

So, the bearish count is starting to look OK at the moment, but is not assured. We just need to keep an eye on the levels mentioned above and hopefully, doing that will keep us on the right side of things. If waves don't follow through as expected for the bearish count, that's a warning that should be heeded given that until we drop below 5096.04 on the labelling I have, there could be more upside to come, even on the bearish count and the bullish count remains very much alive.

7:31 BST - Dollar Update

Currently, the dollar looks like 5 waves up from the low at 80.085, followed by 3 waves down to the 61.8% retracement level which I mentioned in my previous post. From where I have marked wave ii on the 20 min chart below, it looks like 5 waves up, which could be wave [1] of iii:

Dollar 20 min:


While its starting to look like the dollar may have bottomed at 80.085, I think its too early to disregard the risk of further downside. There are various possibilities which I mentioned in my first post yesterday and on the Dollar page (see menu tab above). You can also see the bigger picture showing how the above chart fits in under those links.

For the moment, if the move up from 80.641 where I have labelled wave ii, is wave [1] of iii up, then that low at 80.641 cannot be taken out. If it is, we may still be in wave ii, but then we have to stay above 80.085, otherwise, what we have seen from that low cannot be the start of an impulse wave up in a new minor 3 uptrend.

If we have started minor 3 up, the next level I would like for to be taken out is 82.085, for the reasons mentioned in my first post yesterday. If we get a good wave iii up, that shouldn't be a problem - if wave iii is going to be a 1.618 extension of wave i, it would reach about 83.018.


Tuesday, 10 August 2010

21:19 BST - SPX Update

The Options referred to below are different ways to count the move down from 1219.80 to 1010.91 and you can see them on the 60 min counts page, which will put the charts below into context.

The 10 min charts below show various ways to count the rally from the 1010.91 low on 1 July in the context of the larger picture shown on those 60 min charts.

On the charts of Options 1 and 2, I'm showing a single zig zag. On the chart of Option 3, there is a triple zig zag,  on the chart of Option 4 there's a double zig zag and on the chart of Option 5, there is a single zig zag with an ending diagonal for wave (c).

Here are the 10 min charts:

Options 1 and 2 - from 1010.91, a double zig zag:


I'm only showing the 10 min chart of Option 2 since the counts are now the same under both these Options, namely, a single zig zag which is complete at 1129.24. Here's a more zoomed in look:

SPX 1 min:


I'm showing a bearish count for the action since 1129.24. Obviously, for this count to remain valid, we need to stay below 1129.24. 

To confirm the bearish count, to the downside, we need to drop below the high at 1117.88 which, on a bullish count, could be a first wave in an impulse up from today's low - taking it out would likely preclude that since it would make the move from today's low a 3 wave affair.

We then need to drop below 1111.58 to avoid a possible 1-2 count up from today's low, which, on this zig zag count would be part of an on-going wave c.  

After that the levels we need to take out are the same as yesterday. Taking out 1107.17 would be the next level to watch to gain confidence in a top. While that holds, we could have a 1-2 up from there given today's action.

However, for the moment, the main level to watch remains 1088.01. Taking out 1088.01 would provide a higher degree of confidence in a top since that's the last low that has to survive if wave c is going to extend. on this labelling.  So, until we take out that level, the risk of further upside remains.

Option 3 - from 1010.91, a triple zig zag:


This too, can count as complete at 1129.24 and that's how I've labelled it for the time being. Of course, 1129.24 must remain intact if that is the case.

To the downside,  the levels to watch on this count are the same as under  the single zig zag under Options 1 and 2. While 1111.58 holds, we could have a 1-2 up from there in a continuing (c) wave; while 1107.17 holds, we could have a 1-2 up from there in a continuing (c); while 1088.01 holds, the risk is that 1129.24 was only wave (a) of the final zig zag.

Option 4 - from 1010.91, a double zig zag:


From the low at 1088.01, the count on this chart is the same as the count from that level under Options 1 and 2, so the same comments apply here.

Don't forget the bullish alternative count (see under the 60 min counts page for the bigger picture).

Here it is on a 1 min chart:

SPX 1 min - Option 4, bullish alternative count:


Given the number of ones and twos appearing there remains a possibility that this is a leading diagonal from the 1010.91 low and the high at 1129.24 could be the completion of it. If so, or if it is nearly complete, I would count it as wave [i] of A and we should see a decent retracement in wave [ii] before a wave [iii] kicks off. Obviously, any wave [ii] retracement must stay above 1010.91 for this count to remain valid.

Option 5 - from 1010.91, a single zig zag with an ending diagonal for wave (c):


As explained in last night's update, a complete ending diagonal can be counted into the high at 1129.24. I've labelled it as such. However, we must take out 1107.17 to preclude a continuing wave v in progress where 1129.24 was only wave [A] and 1111.58 was wave [B]. 

As yesterday therefore, that 1107.17 level remains important on this count. If the ending diagonal still has more upside, then it has to remain under 1147.91  since wave v must be shorter than wave iii. Moving above that will invalidate the ending diagonal, but one of the other corrective zig zag counts would then simply replace it on this Option.


19:16 BST - SPX Update - 1 min chart

If we've been seeing a 4th wave correction today, it getting rather large compared to the 2nd wave. That doesn't invalidate it, but it does raise the question whether, perhaps, this is what we're seeing instead:

SPX 1 min:


Obviously, its invalid if we move above 1129.24.

17:34 BST - Dollar Update - 5 wave s up complete?

The dollar can be counted as 5 waves up from the 80.085 low. Here's the 20 min chart I posted this morning, updated:

Dollar 20 min:


Until we drop below the wave [4] low, wave [5] has the potential to extend. If we do drop below that level, if my labels are correct, we should be in wave ii down. 

You can see that a possible target at the 4th wave within wave [3] is also the 61.8% retracement of the move up from 80.085. Obviously, a wave ii retracement will have to stay above 80.085 if this was an impulse up and not a C wave in an on-going correction within a continuing downtrend.

I'll be on the lookout for a 3 wave pullback that ends above that level. Anything that looks too impulsive to the downside should be taken as a warning that we may not have seen an end to the downtrend just yet.


15:15 BST - SPX Update - 1 min close up

Its looking like the alternate count I showed in the close up 1 min chart under Options 1 and 2 in last night's update may be playing out, with a top at 1129.24:

SPX 1 min close up:


We've taken out one of the levels I identified in last night's update, 1120.91, which might give the first sign of a top. However, we now need to go on to take out that 1107.17 level. We should be able to do this if we are going to see 5 waves down from 1129.24.

Of course, we had this on Friday, and that 5th wave never came, so we need to keep a close eye on this. If we're in wave (4), then we can't end above 1126.60 - so in elliott wave terms, that's where we'll know for sure that something is not right with this count, but for me, if we start to move above the 50% retracement level, I'll be highly suspicious.


14:56 BST - SPX Update - 60 min chart

Here's the 60 min chart I've been following (last posted here) SPX is having another go at breaking the uptrend channel from the July low - remember how it bounced sharply up from it on Friday:

SPX 60 min:


All of those indicators currently look pretty bearish - see the notes on the chart.

11:10 BST - Dollar page updated

It shows the updated position on the daily chart. Click on the menu tab above or here.

10:09 BST - Dollar Update

Looking at this 20 min chart of the dollar, (showing the count from the wave (iv) of [v] high at 81.977) its possible that we have seen the end of intermediate wave (2) down;

Dollar 20 min:


You'll see from my last update that I mentioned the possibility that where I had marked a 2nd wave of wave v down, at 80.945, was actually the start of wave v and the drop from there was all or part of wave v. That possibility may be what played out in the end, as you can see from the above chart.

On the provisional labelling I have from the 80.085 low, we haven't yet got 5 waves up, but it looks like we might get that shortly. However, even if we do, we need to be wary of the possibility that this rally is just part of an expanded flat wave iv correction and that we have another down leg to come. This arises because from where I have [W] within wave iv, looks like 3 waves, so taking the count from there, the drop to 80.085 could be a [B] or [X] wave.

Warning bells would start to ring if we take out 80.425 before making a new high above 81.137, if my count from the 80.085 low is correct.

Another risk to watch out for on the downside: this low at 80.085 could just be wave (iii) of [iii] of C. Here's a larger view to show you what I mean:

Dollar 60 min:


You can see that from the wave [ii] high at 84.557, to where I have marked wave [iii] at 82.085, could just be wave (i) of [iii], making this low at 80.085 wave (iii) of [iii]. If we end above 82.085 on this rally, that possibility would be excluded because this rally would be wave (iv) of [iii] under that possibility and wave (iv) mustn't end above the low of wave (i).

So, for this initial move up, we shouldn't fall below 80.425 before we move above the current day's high at 81.137. Assuming we complete 5 waves up from the low on my labelling, the critical level is then, of course 80.085 which must hold.

Once we move above 82.085 we ought to be safe from the possibility that the low at 80.085 was only wave (iii) of [iii].


Monday, 9 August 2010

21:23 BST - SPX UPdate

The Options referred to below are different ways to count the move down from 1219.80 to 1010.91 and you can see them on the 60 min counts page, which will put the charts below into context.

The 10 min charts below show various ways to count the rally from the 1010.91 low on 1 July in the context of the larger picture shown on those 60 min charts.

On the charts of Options 1 and 2, I'm showing a single zig zag. On the chart of Option 3, there is a triple zig zag,  on the chart of Option 4 there's a double zig zag and on the chart of Option 5, there is a single zig zag with an ending diagonal for wave (c).

Here are the 10 min charts:

Options 1 and 2 - from 1010.91, a double zig zag:


I'm only showing the 10 min chart of Option 2 since the counts are now the same under both these Options, namely, a single zig zag which is complete at 1129.24 or nearly complete. Here's a more zoomed in look:

SPX 1 min - top of wave a, wave b and wave c of a single zig zag:


And here's the close up chart I was posting today showing the possibility that we may have topped at 1129.42:

SPX 1 min from 1126.03 high:


Taking out 1120.91, the wave (4) low, would be the first sign that the zig zag is complete. After that, taking out 1107.17 would be the next level to watch to gain confidence in a top. However, taking out 1088.01 would provide a higher degree of confidence since that would avoid the possibility of an extending [C] wave, where 1129.24 was only the 1st wave within the 5 waves required for wave [C]. Until we take out that level, the risk of further upside remains.

Option 3 - from 1010.91, a triple zig zag:


This too, can count as complete at 1129.24 or nearly complete. I think that, as with the single zig zag under Options 1 and 2, a drop below 1120.91 would be an initial sign of a possible top, but we need to take out 1107.17 to gain confidence in thinking that the triple zig zag might be over. That avoids a possible extending (c) wave. However, taking out 1088.01 would increase confidence in a top considerably. Taking out that lower level would avoid the possibility that it was only wave (a) of the third zig zag that topped at 1129.24.

Option 4 - from 1010.91, a double zig zag:


From the low at 1088.01, the count on this chart is the same as the count from that level under Options 1 and 2, so the same comments apply here.

Don't forget the bullish alternative count (see under the 60 min counts page for the bigger picture).

Here it is on a 1 min chart:

SPX 1 min - Option 4, bullish alternative count:


Given the number of ones and twos appearing here, its possible its really a leading diagonal from the 1010.91 low and the high at 1129.24 could be the completion of it. If so, or if it is nearly complete, I would count it as wave [i] of A and we should see a decent retracement in wave [ii] before a wave [iii] kicks off. Obviously, any wave [ii] retracement must stay above 1010.91 for this count to remain valid.

Option 5 - from 1010.91, a single zig zag with an ending diagonal for wave (c):


From what is labelled as the wave (iv) low of the ending diagonal at 1107.17, I can count a zig zag up to the high at 1129.24. The wave a of (v) high would be at 1127.01 and the wave b of (v) low would be at 1124.92. From there its possible to count 5 waves up, but we can't rule out more upside to come, given that wave c of (v) does look a little stunted.

However, so far, the requirements for an ending diagonal have been met - wave (v) can be counted as a zig zag, its moved beyond the high of wave (iii) of the diagonal at 1128.75 and its shorter than wave (iii), having not (so far at least) exceeded 1147.91.

So, while the trend is still up and we have to go with that, there are reasons to be on the look out for a top around here.
I don't think we can really start to have confidence in a top on this count until we take out 1107.17. That is now the level to watch on this count to confirm a top under this Option.


19:50 BST - SPX Update

OK, no truncated top! But we might be fairly close to a top if 1127.01 was wave 3 of (5) and we are now in wave 5 of (5), as shown as an alternative on this close up of today's action:

SPX 1 min from 1126.03:


However, again, with the trend up, assume more upside to come before we can count a top. Taking out 1124.24 in an assumed wave 4 of (5) increases the chance that the alternate is playing out.

19:28 BST - SPX Update

Here's one of the charts I showed earlier which suggested more upside to come to complete a correction from the 1 July low. Its the chart of the single zig zag I have on the 60 min Option 2 chart which had Friday's low as a 4th wave within the c wave of the zig zag:

SPX 1 min - single zig zag, c wave in progress:


It looks like we're into that 5th wave now, looking for a high somewhere above 1128.75.

I mentioned in Friday night's late update the possibility that we might not get much above that level or might even truncate. Here's a close up of today's action which shows a count for a new high in the works, but also shows how we may already have topped with a truncation:

SPX 1 min close up from 1126.03:


The blue dotted lines show a possible triangle for wave (4) and 5 waves up from there to 1127.01. That could be our 5th wave ending in a truncated top. It would mean counting a small leading diagonal down for the first leg down of a larger downtrend, as shown by the dotted red lines.

Obviously, taking out today's high would invalidate this truncated top possibility, but if we don't take it out, it doesn't look too bad.

For the moment, however, since the overall trend is still really up, its safer to assume that we will make a new high. But, if before doing so, we take out 1124.24 or, better still, 1122.57 or 1120.91, the odds start increasing that we may already have seen a truncated top at 1127.01.


16:32 BST - SPX Update

The counts showing a top to a corrective move up since the 1 July low  (see the Option 1 and 4 charts in the last post) are very close to being invalidated or rendered highly unlikely - taking out 1126.56 will do it.

It may be more likely that today's action is a 4th or b wave (see the charts of Options 2, 3 and 5 in the last post). 

We've had what looks like 5 waves down from today's high and a sideways to up move since. This could be a completed 4th or b wave, so we may just have started the next leg up, or we may still have a drop to come to complete either of those. If today's high can remain intact, it could be a (1)-(2) down.

Here's a possible count for today's action:

SPX 1 min - count from 1126.03:


So, for the moment, all counts are still on the table and we just have to wait and see and watch those levels previously indentified.

16:05 BST - SPX Update

Here are some of the counts that I showed on Friday, updated with today's action. Please refer to the updated 60 min counts page for the context of each (I've related each of the short term counts shown here to those 6o min charts):

SPX 1 min - single zig zag complete at 1128.75:


This relates to the Option 1 60 min chart. The [1]-[2]-(1)-(2) held, but only just. We need to stay below 1126.56 and start to drop impulsively.

SPX 1 min - single zig zag still in 5th wave of [c]:


This relates to the Option 2 60 min chart. We need to stay above 1112.06 if we are in wave (iv) of [5], otherwise, this labelling is invalidated. If we take out 1107.17, it may well be that the overall count is invalid.

SPX 1 min - triple zig zag with wave (c) of the final zig zag in progress:


This relates to the Option 3 60 min chart. 

Again, the labelling is invalid if we take out 1112.06 without a new high. However, we may simply still be in wave (b). A drop below 1088.01 increases the likelihood that we're not in this count or that it completed at 1128.56 or 1126.56 (see the counts shown in the secoond and third charts I posted in the 21:49 update on Friday which count a top into either of those two levels).

SPX 1 min - double zig zag complete at 1126.56:


This relates to the Option 4 60 min chart. However, please note that it may be incomplete - its really the same as the alternatives shown in the first two charts above for the single zig zag.

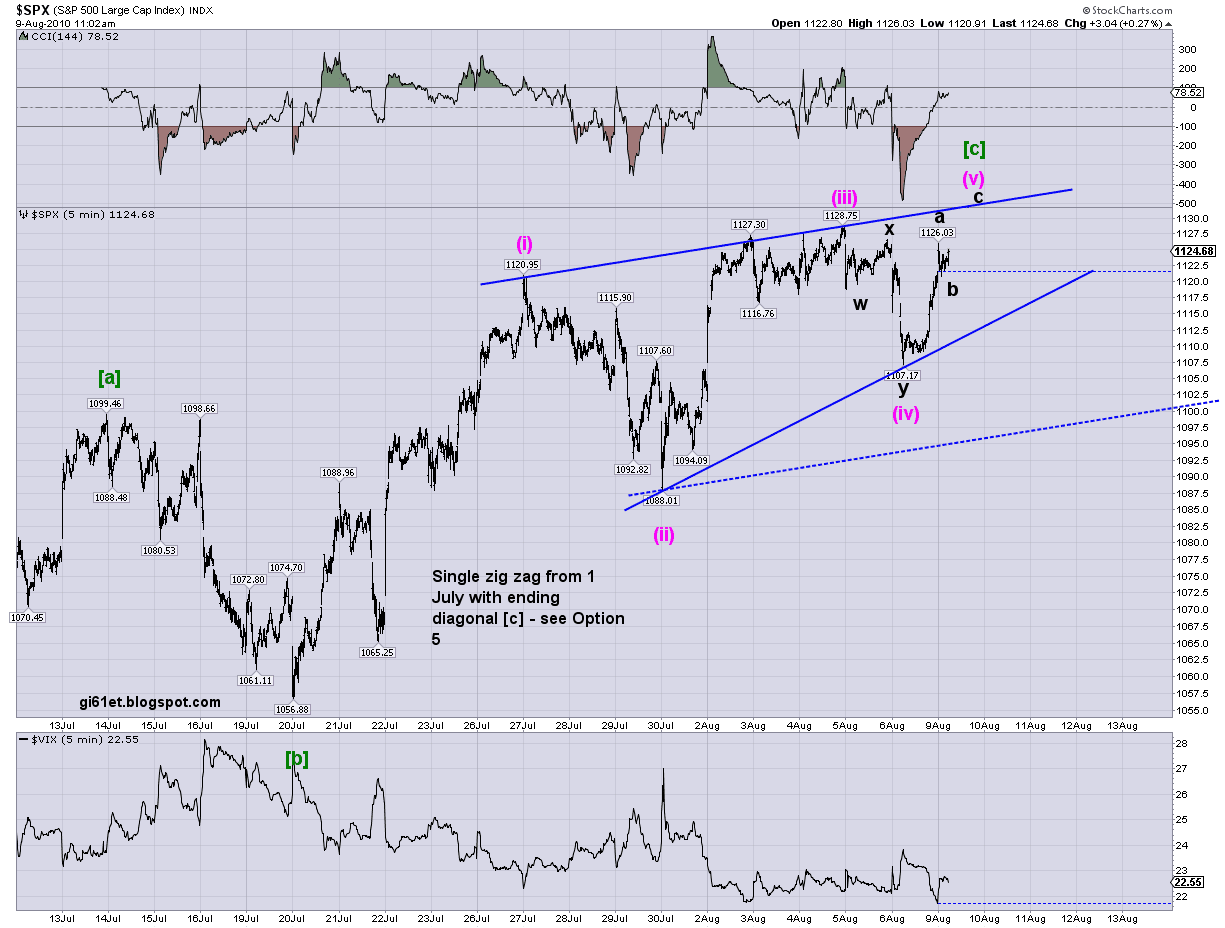
SPX 5 min - single zig zag with ending diagonal (c) wave in progress:


This relates to the 60 min chart of Option 5.

Wave (v) must be a zig zag, must make a new high above 1128.75 and must stay under 1147.91. Moving to the blue dotted line before a new high will invalidate the diagonal.