
Here are some of the counts that I showed on Friday, updated with today's action. Please refer to the updated 60 min counts page for the context of each (I've related each of the short term counts shown here to those 6o min charts):
SPX 1 min - single zig zag complete at 1128.75:

This relates to the Option 1 60 min chart. The [1]-[2]-(1)-(2) held, but only just. We need to stay below 1126.56 and start to drop impulsively.
SPX 1 min - single zig zag still in 5th wave of [c]:

This relates to the Option 2 60 min chart. We need to stay above 1112.06 if we are in wave (iv) of [5], otherwise, this labelling is invalidated. If we take out 1107.17, it may well be that the overall count is invalid.
SPX 1 min - triple zig zag with wave (c) of the final zig zag in progress:

This relates to the Option 3 60 min chart.
Again, the labelling is invalid if we take out 1112.06 without a new high. However, we may simply still be in wave (b). A drop below 1088.01 increases the likelihood that we're not in this count or that it completed at 1128.56 or 1126.56 (see the counts shown in the secoond and third charts I posted in the 21:49 update on Friday which count a top into either of those two levels).
SPX 1 min - double zig zag complete at 1126.56:

This relates to the Option 4 60 min chart. However, please note that it may be incomplete - its really the same as the alternatives shown in the first two charts above for the single zig zag.
SPX 5 min - single zig zag with ending diagonal (c) wave in progress:
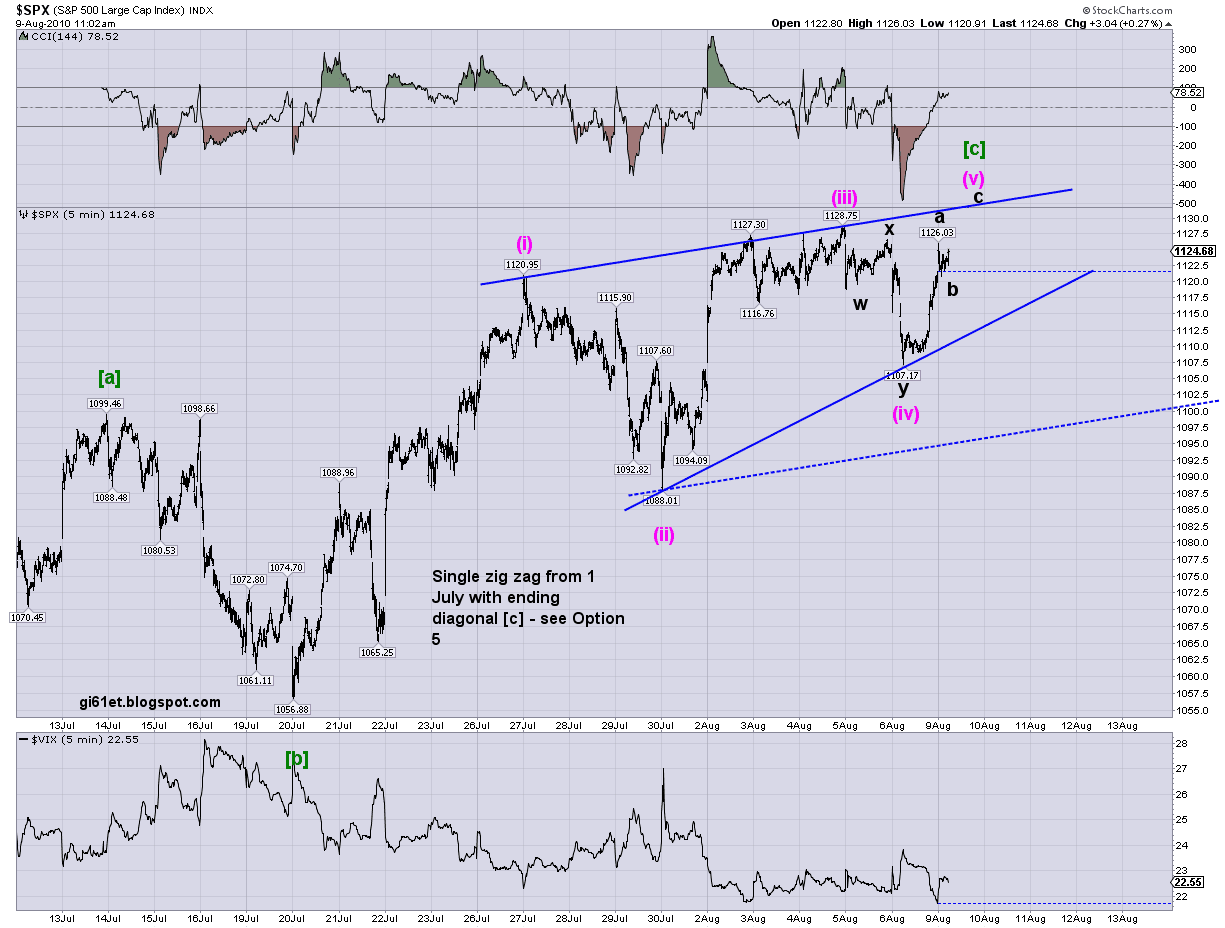
This relates to the 60 min chart of Option 5.
Wave (v) must be a zig zag, must make a new high above 1128.75 and must stay under 1147.91. Moving to the blue dotted line before a new high will invalidate the diagonal.