Menu

Monday, 11 October 2010

21:16 BST - SPX End of Day Update

On the 3 Options set out on the 60 min counts page, I'm still waiting for the end of 5 waves up from the August low  to mark the end of minor 2 (or, now less likely, (i) of [c] of 2) on Option 1, the end of wave X on Option 2 or the end of wave [i] of C (or (i) of [iii] of A) on Option 3.

We made another new high for the rally from the August low, but the question remains whether that new high is the end of the rally from that low or whether there is still more upside to come.

You can see the bigger picture into which the following charts fit by going to the 60 min counts page where you'll find the 3 Options I'm following for the move down from the April 2010 high.

The first chart is labelled as if Option 1 is playing out:

Chart 1: SPX 1 min - 5 waves up from the August low with a possible ending diagonal for wave (v): 


This diagonal could be complete at today's high.

Its also possible that today's high was only the end of wave iii of the diagonal, and we're now in wave iv. If we drop to the black dotted line in an assumed wave iv, this possibility is excluded.

The alternative to a diagonal from the 1131.87 low is that we're just seeing a straight impulse wave up from that low at 1131.87, with the low at 1151.41 being wave iv of (v). 

For this possibility, there are a number of ways to count the move up from the wave iv of (v) low at 1151.41. I've amended these from earlier to take into account today's action (this chart assumes that Option 3 is playing out):

Chart 2: SPX 1 min - 5 waves up from August low with wave v of (v) starting at 1151.41:


The main labelling assumes that  this impulse topped at 1168.88 with wave v forming an ending diagonal.

The alternate count labelled is more bullish and assumes we're still in wave v of (v) which is subdividing. The diagonal that I've labelled from the 1151.41 low would be wave [1] of v. with wave [2] now in progress. I don't really like this alternative since its likely to mean a very large wave v compared to wave i. However, until we take out 1151.41, it remains on the table.

Finally the other possible way to count this which I mentioned in an intra day update last Thursday (but not shown on the charts) is that the high at 1163.87 may have been wave i of (v) and the decline we saw from there to 1151.41 was wave ii. This would mean a potentially substantial rally coming in wave iii. If we've had a diagonal from 1151.41, that could be a leading diagonal for the first wave of wave iii. I still consider this count  to be low probability since wave ii  would only be a 38.2% retracement of the rally from 1131.87, which is perhaps rather shallow for a 2nd wave, but also because it might make wave (v) somewhat out of proportion to wave (i) in the rally from the August low. However, we'll have to see how price action develops. Only taking out the 1131.87 low would eliminate this.

So, many possibilities remain. I tend to favour the count in Chart 1 above, so there, I'm watching for the decline from the high at 1168.88 to drop to the black dotted line to exclude the possibility that 1168.88 was only wave iii in the diagonal.

After that, the key level I'm watching is 1151.41 to exclude the extending wave v shown by the alternate labels on Chart 2. Then I'll be watching 1131.87 to exclude the i-ii count from the 1131.87 low..

15:41 BST - SPX Update

With another new high for the rally from the August low, here's how its looking to me at the moment. Firstly, here's the ending diagonal shown in Chart 1 in Friday's end of day update:

SPX 1 min - ending diagonal wave (v) from the 1131.87 low:


As noted on the chart, if this count is playing out, wave v of (v) has to stay below 1176.18 in order to remain shorter than wave iii. If we're only in wave iii of the diagonal, it has to stay below 1183.41.

Here's the impulse wave up from 1131.81 shown in Chart 2 in Friday's end of day update:

SPX 1 min - impulse from 1131.87:


If this is what is going on, we may be getting an extending wave [5] of v or, we could be seeing wave v of (v) itself developing in a series of ones and twos. 

The alternate which has to be considered when ones and twos appear is a diagonal - this one would be a diagonal for wave v  of (v) with wave (1) of the diagonal at the high of 1165.99, wave (2) at the low of 1161.60 and wave (3) in progress - I've sketched in the lines of the diagonal. If wave (3) is still in progress, it has to stay below 1176.18 for the diagonal to remain valid. It may be that wave (3) ended at 1167.73 (where I have the wave (1) of [5] label currently), and today's low was wave (4). In that case, wave (5) would have to stay below 1170.61.

So, those are the possibilities I'm looking at at the moment - until we see a decisive and impulsive move down, the trend remains up. The first level I'm looking at to consider we may have seen a top is 1161.60, as noted in Friday's end of day update.

Saturday, 9 October 2010

12:47 BST - SPX Update on the cycles from the March 2000 high

Here's an update on the chart of two cycles I look at which eminate from the March 2000 high (the original post on this can be found by clicking here):

SPX Cycles from the March 2000 high:


As you can see, the turn that was expected around the 22/23 September became a turn back up as price move down into 23 September but then gapped up the following day. The gap up was the signal that all was not well with the move down that had started on 21 September since on 23 September we closed near the low of the day - the gap up was a significant failure to follow through on that bearish close. You'll note how the same thing happened at the next red cycle date on 1 October which may also have been a reversal down date. The next trading day, however, price gapped up.

We're now approaching the next turn period which falls between 12 and 14 October (the next red and grey cycle lines , respectively). Again, as emphasised previously, price action is key - bearish bars should follow through; if they don't, its a warning that should be heeded, especially since the trend remains up at this stage.

I've marked on the charts the pivots I'm watching at the moment. If the market is to make a significant turn down, these three pivots should be taken out without any difficulty. A failure to do so will suggest that further upside may be on the cards.


12:04 BST - Update on the CBOE Options Equity Put/Call ratio, S&P 500 Stocks above their 50ma and NYSE Tick

The 5ma and 10ma on the $CPCE chart have given a sell signal by the 5ma crossing above the 10ma. However, you can see that for the past month or so, they've been stuck below the blue dotted line and as you can see from the two areas highlighted in green, when this has happened in the past, there have been false signals given while the market grinds higher - I've mentioned this problem in previous posts, most recently on 23 September - see here:

CBOE Equity Put/Call Ratio:


As at the time of that last post, with the market continuing to move up, we've seen the moving averages of the CPCE stay within the downward pink channel (a downward channel is bullish for the market). However, its interesting that they haven't actually moved down within the channel, but instead have moved sideways. Also, there are higher lows in both moving averages within this sideways movement. I consider both of these points as potentially bearish for the market.

As I've said before, there's nothing wrong taking a position on the moving average cross, but with the prevalence of false signals given whilst below the blue dotted line, its imperative to manage the trade with that risk in mind.

What I'm looking for is a clear break of these moving averages above the pink channel and above the blue dotted line while price falls. This would be bearish for the market. 

If any such price fall is sustainable, rallies should not result in the moving averages of the CPCE coming back significantly into the pink channel. 

On the other hand, if all we see is these moving averages move up to touch the upper line of the pink channel and then come back down again, that's only going to validate the channel further and would suggest more upside in the markets. As long as we stay in the pink channel, that is bullish for the markets.

I've re-drawn the black channel from last time.  It remains a tentative channel until I see more action in these moving averages. If they (and in particular the 10ma) can stay above the lower black line, that would be bearish for the market.

In the lower window you can see that there is significant bearish divergence between price and the McClellan Oscillator, not only since mid September, but also between the August and the October highs - I've drawn a red channel based on the latter divergence. 

To me, this indicates some serious underlying weakness in the market.  Of course, this could be negated with just one big push up in the Oscillator, but its certainly suggesting caution on the long side for the moment. A break of the small bear flag that I've marked in green may be a bad sign for the uptrend in the market.

The S&P500 Percent of Stocks above their 50ma has been lingering in the area where it has previously given good sell signals:


We did get a sell signal (the index moved below its 13ma) shortly after my last post on this, (see the last red vertical line) but it was quickly reversed, as I recall, the very next day (in fact, the futures reversed up overnight and so unless you had intra day data on this index, you wouldn't have taken a trade based on the signal).

At the moment, there's no sell signal, but there was divergence between this index and the market on Friday. It failed to make a new high while the market did. Its also notable that the technical indicators for this index are also showing bearish divergence against its recent push up.

So, this one is something I'm going to be watching closely.

The NYSE Tick is also showing bearish divergence in relation to market action:


The new highs we saw on Friday did produce a move up in the 13ma of the Tick, but its significantly below where it was at the August and September highs. Again, this suggests to me underlying weakness, so caution on the long side for the time being, unless it can start making new highs with the market.

Friday, 8 October 2010

21:13 BST - SPX End of day Update

On the 3 Options set out on the 60 min counts page, I'm still waiting for the end of 5 waves up from the August low  to mark the end of minor 2 (or, now less likely, (i) of [c] of 2) on Option 1, the end of wave X on Option 2 or the end of wave [i] of C (or (i) of [iii] of A) on Option 3.

We made another new high for the rally from the August low, but the question remains whether that new high is the end of the rally from that low or whether there is still more upside to come.

You can see the bigger picture into which the following charts fit by going to the 60 min counts page where you'll find the 3 Options I'm following for the move down from the April 2010 high.

These charts are labelled as if Option 3 is playing out:

Chart 1: SPX 1 min - 5 waves up from the August low with a possible ending diagonal for wave (v): 


This is the chart I posted intra day showing a possible ending diagonal for wave (v). It could be complete at today's high, or that high may only have been wave iii. If we decline to the black dotted line, then I'd count the diagonal as complete. 

The question then will be whether or not it was a diagonal or whether we're seeing the development of ones and twos in a more bullish move up. Taking out the low at 1151.41 would make me start to think that it was a diagonal, but it wouldn't be conclusive - we'd have to take out the low at 1131.87 to get confirmation.

The other possibility is that we're just seeing a straight impulse wave up from the wave (iv) low at 1131.87, with the low at 1151.41 being wave iv of (v).This is shown in the close up chart I've been posting. For this possibility, there are a number of ways to count the move up from the wave iv of (v) low at 1151.41 as you can see from the chart below:

Chart 2: SPX 1 min - 5 waves up from August low with wave v of (v) starting at 1151.41:


The main labelling assumes we're on the verge of completing wave v of (v) if we haven't already done so. The alternate count labelled is more bullish and assumes we're still in wave [3] of v of (v). If we were to take out 1161.60 at this stage, the main labelling would become the more likely, although I'd then like to see 1155.58 get taken out very quickly after that in order to avoid the possibility that wave (2) has formed a very complex expanded flat type of correction (this seems unlikely at this stage, in my view).

If we can take out those two levels, I would then want to see a swift move to below 1151.41 and then, of course, 1131.87 would be the real focus.

Don't forget the other possible way to count this which I mentioned in an intra day update yesterday -  the high at 1163.87 may have been wave i of (v) and the decline we saw from there to 1151.41 was wave ii. This would mean a potentially substantial rally coming in wave iii. I'm still thinking this count would be low probability since wave ii  would only be a 38.2% retracement of the rally from 1131.87, which is perhaps rather shallow for a 2nd wave, but also because it might make wave (v) somewhat out of proportion to wave (i) in the rally from the August low. However, we'll have to see how price action develops. Only taking out the 1131.87 low would eliminate this.

So, the levels on my radar after today'a action are 1161.60, 1155.58, 1151.41. If we can take those out, the odds increase that a top for the rally from the August low is in. However, this won't be confirmed until we take out 1131.87 on the counts as I have them labelled.

Have a great weekend!

19:13 BST - SPX Update - the 60 min may be starting to show signs of a top

There are some nice divergences in the technical indicators on the 60 min chart that hint at a top for the rally from the August low being not too far off - they do look like they're starting to roll over:

SPX 60 min:


Now we just need some bearish price action which is also confirmed by these indicators moving to bearish levels: RSI to 30, CCI to -100, MACD and its histogram below zero, -DI above the +DI and the ADX above 25 indicating a strong downtrend (its interesting that the rally from the October low didn't push the ADX above 25 - that suggests underlying weakness to me).

A move down in price that doesn't have this effect on the indicators is likely a warning that the decline is just a correction. Equally, price moving sideways while these indicators move to bearish levels is also likely to be a warning of more upside to come.

18:58 BST - SPX Update: Possible top in, but beware of the alternatives still in play

Its possible that we've completed 5 waves up from the 1151.41 low to complete wave v and (v):

SPX 1 min:


However:

1) until we take out 1161.09, we could still be in an expanded flat wave [4]; and 

2) until we take out 1158.58, we could be in an expanded flat wave (2); and

3) until we take out 1151.41, we could only have seen wave [1] of v at today's high.

17:58 BST - SPX Update

With what should have been wave (2) of [3]  (see my last post) being so shallow a retracement, the alternative I mentioned in the last post, that the rally from 1155.58 was the whole of [3] seems like a better count currently:

SPX 1 min:


Taking out the wave [4] low at 1162.79 would increase the odds in favour of this. However, be aware that 5 waves up from 1151.41 could be wave [1] of v, not the whole of v - we have to take out the low at 1151.41 to confirm the end of the rally from that low.

16:52 BST - SPX Update - bullish count wins: impulse or ending diagonal for wave (v)?

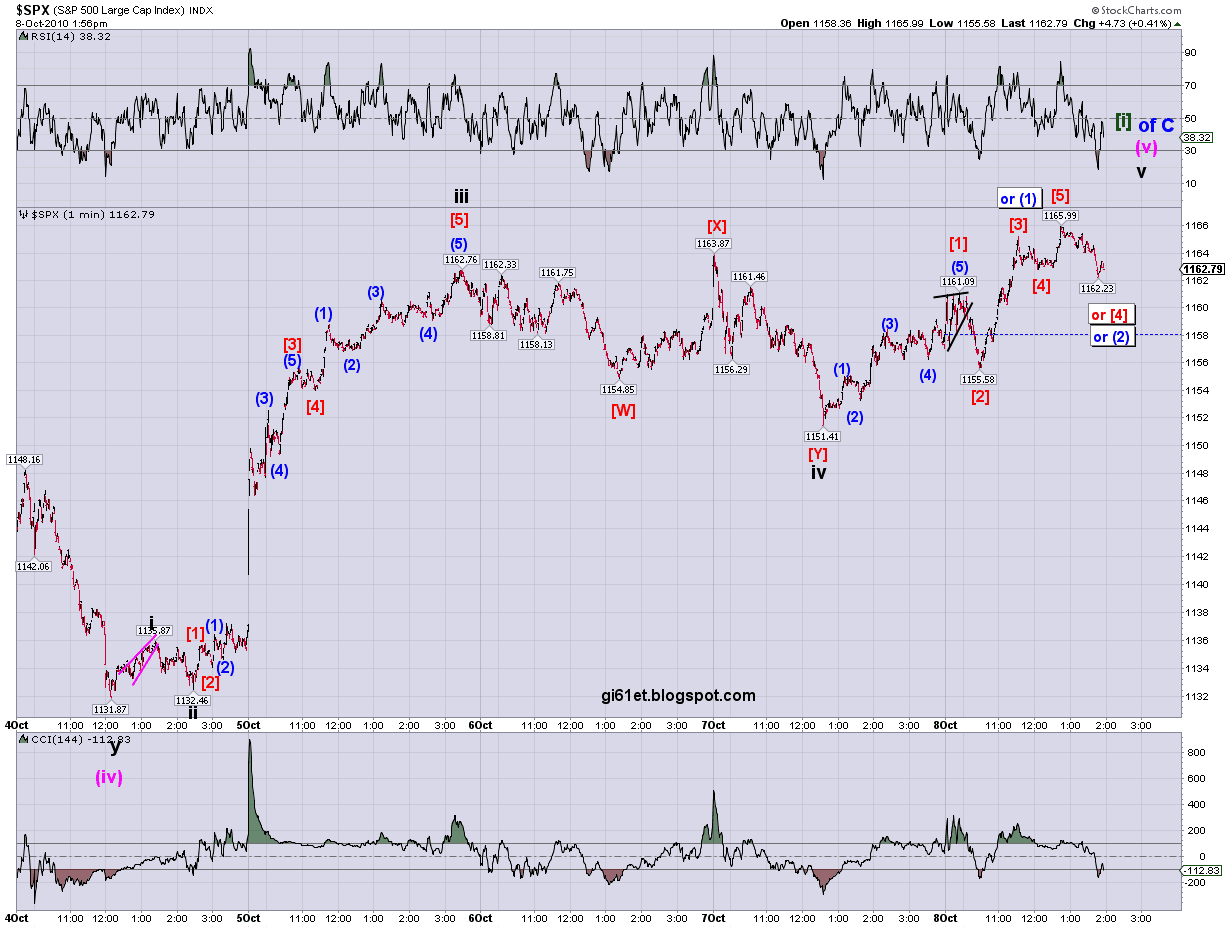
So, the bullish count wins. Its possible  that wave (v) is forming an ending diagonal starting at 1131.87, as shown on the following chart:

SPX 1 min - wave (v) in progress - possible ending diagonal:


If its labelled correctly, then wave iv of the diagonal needs to stay above the black dotted line, otherwise, the diagonal is invalid and I'll be looking for a straight impulse wave up from the 1151.41 low. As to that, here's the close up:

SPX 1 min - bullish count close up - looking for 5 waves up from 1151.41:


Its possible that the high labelled (1) of [3] is the whole of [3] - if that's the case, wave [4] must stay above the wave [1] high at 1161.09. If we take that out, I'll assume that the labelling above is correct. If we drop below 1155.58, this impulse wave up from 1151.41 will be questionable and I'll be focusing then on the ending diagonal possibility.

16:22 BST - SPX Update on the bullish and bearish counts

Until we take out the high at 1163.87, the bear count stands, albeit with adjustments as price action develops. Here is how I'm counting it now:

SPX 1 min - bear count:

I've changed it from an (A)-(B)-(C) to a (W)-(X)-(Y). So, 1163.87 remains the level to watch to the upside. 

To the downside, if we take out today's low at 1155.58, the bullish count will start to look very dodgy, but it won't be ruled out until we drop below 1151.41. 
Here's the updated bullish count:

SPX 1 min - bullish count:

Wave [2] retraced 61.8% of wave [1]. I can count 5 waves up from the wave [2] low either complete or nearly complete, so I've labelled it as wave (1) of [3], but if its really bullish, it may just extend higher before its complete.

Again, we really need to stay above 1155.58, but the 1151.41 low is the critical one.

15:16 BST - SPX Update: Possible count for 5 waves up from 1151.41

The action this morning could be an ending diagonal 5th wave in the move up from the low at 1151 41. Here it is on the chart of the near term bullish count (on the bearish count the 5 waves up from that low would be wave (C) of [2] in a new down move - see Chart 1 in yesterday's end of day update):

SPX 1 min - 5 waves up from 1151.41:


I can count the diagonal as complete at the high of 1161.09, but its equally possible that it still needs one more high. If we take out 1157.24, I'd look at it as complete. Also, reaching the dotted black line would suggest its complete.

Once we have 5 waves up from 1151.41, we need to stay above that level for the bullish count and we have to break below it for the bearish count. Nice and simple!

Thursday, 7 October 2010

21:14 BST - SPX End of Day Update

On the 3 Options set out on the 60 min counts page, the search  continues for the end of 5 waves up from the August low  to mark the end of minor 2 (or (i) of [c] of 2) on Option 1, the end of wave X on Option 2 or the end of wave [i] of C (or (i) of [iii] of A) on Option 3.

We made another new high for the rally from the August low, but the question remains whether that new high was the end of the rally from the August low or whether there is still more upside to come.

The problem for the immediately bearish case is that we haven't yet seen a clear 5 wave impulsive decline taking out any significant levels so the risk of further upside continues.

You can see the bigger picture into which the following zoomed in charts fit by going to the 60 min counts page where you'll find the 3 Options I'm following for the move down from the April 2010 high.

The first chart is labelled as if Option 1 is playing out and assumes that we topped at 1163.87:

Chart 1: SPX 1 min - 5 waves up from the August low, close up:


I don't especially like this count, but its valid and with all other possibilities for the immediately bearish case now eliminated, it'll have to do!

As I said above, the problem with the bearish case is that for some time, the only 5 wave declines we've seen have been quickly overlapped by what, until then, was assumed to be a 4th wave. This has meant that we're left having to count nested ones and twos down and these, in turn, have also failed. 

We saw the same situation today, and this has left the bear case with only the count shown above.

It may not be very attractive, but until we take out the high at  1163.87 it is feasible. The odds for this count would greatly improve if we take out the low at 1151.41.

Turning to the near term bullish count, this second chart is labelled as if Option 3 is playing out and assumes we still have more upside to come:

Chart 2: SPX 1 min - 5 waves up from August low still in progress:


For this count we have to stay above 1151.41 for it to remain valid. If this count is playing out, then a possible target area for the end of wave (v) would be around the 1173 level which is about the 78.6% retracement of the decline from 1219.80 and also the next higher Gann price level based on the 1039.70 low.

Don't forget the other possible way to count this which I mentioned in the intra day updates - today's high was only wave i of (v) and the decline we saw from there was wave ii. This would mean a potentially substantial rally coming in wave iii. At the moment, I think this count would be low probability since today's decline only retraced 38.2% of the rally from 1131.87, which is perhaps rather shallow for a 2nd wave, but also because it might make wave (v) somewhat out of proportion to wave (i) in the rally from the August low. However, we'll have to see how price action develops.

So, the levels I'm watching for now are 1163.87 and 1151.41. 

20:07 BST - SPX Update - wave v of (v) up?

Here's what I'm looking at on the near term bullish count where today's low was wave iv of (v). Unless we take out 1151.41 without a new high, this count remains on the table (wave [1] may have topped at 1158.50):

SPX 1 min - still in wave v of (v):


Note that on the immediately bearish count, 5 waves up from today's low could be wave (C) in a running or expanded flat for wave [2]  -  I mentioned  that as a possibility in the last post.

14:44 BST - SPX Update on the (1)-(2)-1-2 count

The options for the immediately bearish count are narrowing. This was my least favourite way to count the decline from today's high, but, other than a big expanded flat for wave [2], it may be the most likely bear count - its invalidated above 1158.72. In that case, the expanded flat wave [2] will be the bear count and its not pretty:

SPX 1 min - top in at 1163.87 or still in wave iv:


The move up from today's low could be counted as 5 waves for wave [1] of v on the alternate labelling on this chart and that possibility stands until we take out the low at 1151.41.

18:29 BST - SPX Update on the (1)-(2)-1-2 down

Referring to my last post, I'm not sure I like the depth of that wave 4 of (3) on the main count which assumes we topped at 1163.87.  The previous count isn't invalid, but  still, I've re-labelled the (1)-(2)-1-2 as shown below:

SPX 1 min - top in at 1163.87 or still in wave iv?

For this labelling, 1157.42, the wave (2) high, is the invalidation point.

17:45 BST - SPX Update: Top in at 1163.87 or still in wave iv of (v)..... or wave ii of (v)

The ending diagonal and the subdividing wave v of (v) have been eliminated, so the other possibilities mentioned in my previous post become the focus, namely, that we topped at 1163.87, or that we're still in wave iv:

SPX 1 min - top in at 1163.87 or still in wave iv?


The wave iv alternative count may be starting to look unlikley given its size in relation to wave ii, but strictly, its not invalidated unless we take out the wave i high at 1135.87.

The further alternative to this decline being wave iv of (v) is that its wave ii of (v), with today's high being wave i of (v) - something to watch out for, in my view. Its not invalidated unless we take out the wave (iv) low at 1131.87.

If we have topped, then we shouldn't have any difficulty taking out the 1131.87 low and that's the next target to watch for confirmation that some sort of top may be in. In the meantime, to the upside, if we're in wave 3 of (3) now, the next rally should be wave 4 and must stay below the wave 1 low at 1156.43.

15:34 BST - SPX Update: wave v of (v) subdividing or ending diagonal forming?

Here are two possibilities for the move from the 1131.87 low (the labelling on this chart assumes Option 1 on the 60 min counts page is playing out):

SPX 1 min - wave v of (v) subdividing or ending diagonal forming?


The main labelling implies a fair amount more upside. As mentioned in my previous post, one of the levels I wanted to see taken out was 1156.22. We just missed doing so, which means there is the possibility that wave [3] of v is subdividing.

The alternative count that I've labelled would be more limited: if the labels are correct for the diagonal, wave iii is 9.02 points so wave v has to stay below 1165.31, assuming wave v of the diagonal started at 1156.29. Taking out the black dotted line invalidates the diagonal.

The more bearish possibility is that today's high was the end of the rally and we're in the process of forming a larger impulse wave down - the odds of this would increase if we take out 1154.88 and make a clear 5 waves down in doing so. However, the possibility that a big expanded flat wave iv is still forming can't be ruled out - we'd just have to see what happens if and when we get 5 waves down.

14:48 BST- SPX Update

If we take out the high of wave [1] of v on the chart in my last post (its at 1158.41), before we make a new high above 1163.87, I'm going to start thinking today's high is the end of wave [5] of v, not [3] of v. The probability of that increases if we take out the low of wave [2] at 1156.22. However, I then want to see 1154.85 go too.

14:37 BST - SPX Update: Still looking for 5 waves up from 1131.87

With the high at 1162.76 taken out, the count that had yesterday's move as a 4th wave of some degree is now the focus. As mentioned in yesterday's updates, this was always the risk given that the market again did not put in 5 waves to the downside - the decline from the 1162.76 high was only 3 waves. 

So, with the re-labelling I mentioned might be necessary, this is how it looks (the chart is labelled as if Option 3 on the 60 min counts page is playing out, but you can see on that page what 5 waves up from the August low would mean on the more bearish counts under Options 1 an 2 on that page):

SPX 1 min - 5 waves up from the August low, close up from 1131.87 wave (iv) low:


The next Gann price level above 1156 is 1173 and that coincides with the 78.6% retracement level of the decline from 1219.80. The price range between 1156 to 1173 is an area to watch for price action that might suggest a top is in for the rally from the August low. 

However, as always, until we see an impulsive move to the downside that takes out a significant pivot, the risk of further upside remains. Currently, the level I'm focusing on is at 1154.85.

Wednesday, 6 October 2010

21:18 BST - SPX End of Day Update

On the 3 Options set out on the 60 min counts page, I've been  looking for the end of 5 waves up from the August low  to mark the end of minor 2 (or (i) of [c] of 2) on Option 1, the end of wave X on Option 2 or the end of wave [i] of C (or (i) of [iii] of A) on Option 3.

We stayed below the high of 1162.76, so that high remains a potential top for the rally from the August low.

However, we haven't yet seen a clear 5 wave impulsive decline from that high, taking out any significant levels so the risk of further upside continues.

You can see the bigger picture into which the following chart fits by going to the 60 min counts page where you'll find the 3 Options I'm following for the move down from the April 2010 high. The following chart is labelled as if Option 1 is playing out and zooms in on the action from the wave (iii) of [c] high at 1157.16. Its updated from the earlier posts to take account of subsequent price action:

SPX 1 min - 5 waves up from the August low, close up:


I've labelled it as if we've compled 5 waves up from the August low. Its tentative at the moment because, as explained in the intra day updates, we haven't seen anything yet to enable us to have any great confidence that a top is in. 

The 3 waves down from the high that we've seen so far could be wave [4]  or iv (on this or some variation of this count). The diagonal I've sketched in from today's low for wave a of 2 could be the start of wave [5] or v up. We need to take out the low at 1154.85 to preclude that. The (1)-(2)-1-2 that I've labelled will be invalidated if we move above the high at 1161.75 in an assumed wave 2. If that happens, the likelihood of a new high will be signifcantly increased.

As I said yesterday, to really start thinking that we've seen a top of some sort (what it represent will depend on which Option is playing out), we need to see an impulsive 5 wave decline that takes out a pivot that would enable us to eliminate the bullish possibilities. On the count I've labelled, the two levels I'm continuing to watch are 1152.50 and 1149.21.

I'm watching these levels because on the labelling I have,  its possible that the high I've labelled as wave iii at 1152.50 is only wave [1] of iii (and the high at 1162.76 would be wave [3] of iii). If we take out that high in an assumed wave [4] of iii, that possibility will be ruled out. I'd then want to see the low at 1149.21 which I've labelled as wave iv get taken out to preclude the possibility that wave v might extend.

Of course, taking out those levels doesn't preclude further upside, because on the bigger picture, there are levels lower down that need to be taken out if we have seen the end of 5 waves up from the August low. The first of those will be the low labelled as wave (iv) at 1131.87 (to preclude the possibility that wave (v) is extending).

So, the levels I'm watching for now are 1161.75, 1152.50 and 1149.21.  Taking out 1161.75 reduces the likelihood that we've seen a top and we'll probably go on to take out the high at 1162.76. Taking out 1152.50 and then 1149.21 will greatly increase confidence that a top is in at 1162.76.