Menu

Thursday, 23 September 2010

21:16 BST - SPX End of Day Update

On the 3 bullish to bearish Options set out in Friday's end of day update, I'm still awaiting confirmation whether or not we've seen the completion of 5 waves or a diagonal up from the August low at yesterday's high of 1148.59  (the diagonal would be an ending or leading diagonal, depending on which of the Options you're looking at). 

Please refer to the 60 min charts in Friday's end of day update for context (the following charts are based on the bearish count shown in Option 1 in that update).

I said in last night's end of day update that one of the levels I was watching was 1131.47. Well, we did take out that high so excluded the possibility that from the high at 1148.59 we were in wave (4) of [5] up - see chart 2 in yesterday's end of day update. However, we didn't take out the next level I was watching at 1119.77 and instead rallied quite steeply. This suggested a different count might be in play which had us in wave [4] of v, with wave [5] up still to come, as shown in my update at 15:32 BST (see here).

So, we remain pretty much where we were yesterday, despite today' late decline, with the choice being either that a top for the rally from 1039.70 is in at 1148.59, or we have one more high to come.

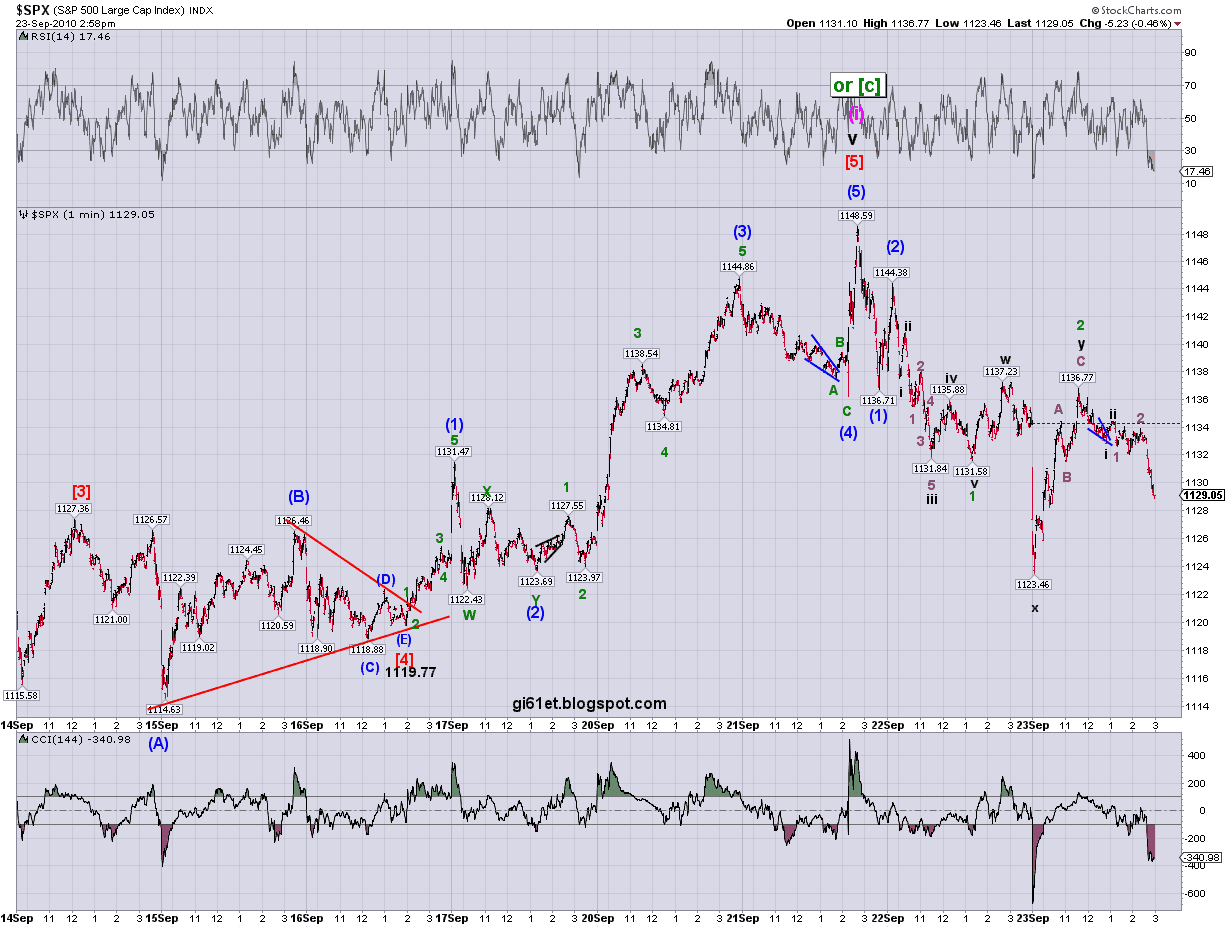
Chart 1: SPX 1 min - top is in at 1148.59 - impulse (on Options 1 and 2)/correction (on Option 3) down has started:


The labelling relates to the bearish count shown in Option 1 in last Friday's end of day update. Although I've labelled it as if we've only completed wave (i) of [c], given how far we've come, I'm more inclined to think that the rally since August is the whole of [c], so the end of minor wave 2.

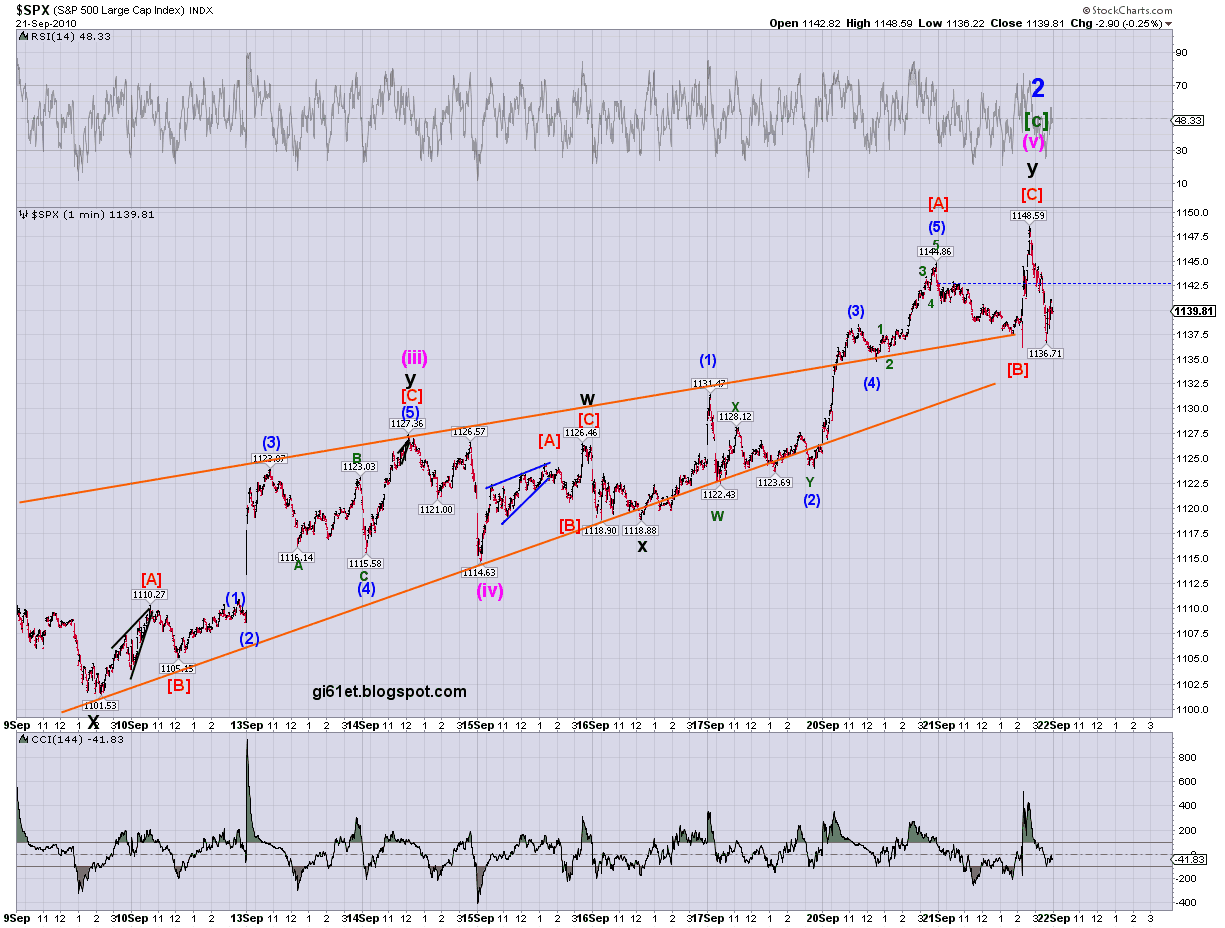
This count assumes that the rally from the August low has topped and that we are now going to see at least a reasonable decline. You can see a wider view of this count on the third chart in the end of day update from 21 September - click here.

On the bearish counts (Options 1 and 2 in last Friday's end of day update) this move down would be the early stages of wave [1] down. We should eventually be headed down below the August low (on Option 1 I'm assuming that the high at 1148.59 is the end of wave [c], not just part of it, as mentioned above).

On the bullish count (Option 3 in that update) this move down would be wave (a) or (w) of [ii] down and we're only going to retrace a portion of the rally. Wave (a) may take the form of 5 waves, or it may just form 3 waves. Wave (w) would be 3 waves. 

Since we have 3 waves down from 1148.59 to 1131.58, its possible that that low marks the end of wave (w) of [ii] as a zig zag. What followed would be wave (x) as an expanded flat correction. So we'd now be in wave (y) which could form as another zig zag, but it could take any other corrective form, so we'll just have to wait and see (you can see what I mean for this (w)-(x)-(y) wave on chart 2 below). Alternatively, we may still be in the early stages of a 5 wave move for wave (a) of [ii] which would be labelled as shown on the above chart (except that the degrees would be different of course).

For the bearish count, or if we're forming 5 waves for (a) of [ii] on the bullish count, I'll stick with the labelling on chart 1 for the moment. 

Bearing in mind my comments in relation to the bullish count below, I think that the level to watch now on this count is 1110.27 - if that level is taken out then the bullish count is invalidated. 

This (1)-(2)-1-2 will be invalidated if we take out 1144.38, but I think that taking out 1136.77 at this stage would create concern that this count isn't playing out.

Chart 2: SPX 1 min - final leg of the rally still to come: 


You can see the wider view of this count on the chart posted at 15:32 BST (click here). Although the intraday labelling that had us starting wave [5] up has been invalidated, the possibility that we're in wave [4] with wave [5] up to come remains until we take out the high of wave [1] at 1110.27.

Although I've labelled it as if we're still in wave (Y) of [4], it may well be complete at the late afternoon low, in which case, we'd expect a rally starting tomorrow.

As long as we stay above 1110.27, this count suggests a new high above 1148.59. 

So, after today's action, the main levels I'm watching are 1110.27, 1136.77 and 1144.38. Taking out the first one will invalidate the bullish count. Takking out the second one will make the bearish count less likely. Taking out the third will render the bearish count invalid.

19:59 BST - SPX Update on the bullish and bearish counts

On the bullish count I'm inclined to think that we completed wave (1) of [5] at today's high since the move down from there has become rather out of proportion to be wave 4 of (1). If we decline below 1127.66 (see the previous posts) now, that would exclude the wave 4 of (1) count anyway, but even if we don't, I think I prefer this count for the time being:

SPX 1 min - one more high to come:


Taking out today's low will invalidate this one.

On the bearish count, I'm going with this for the moment:
SPX 1 min - top in at 1148.59:


We have to take out today's low for this to be a possibility. If we're still actually in wave 2, we may well end up taking out today's high - that's fine. It will invalidate this labelling but as long as we don't get above 1144.38, the (1)-(2)-1-2 possibility will still remain.

17:35 BST - SPX Update: 60 min time and price chart

Just looking at the 60 min time and price chart, it doesn't seem to be over for the immediately bearish case - well, not just yet. Although the rally from today's low has appeared pretty strong, we're still in the lower half of the channel drawn through the time and price lines and below the last Gann price level that price broke down from yesterday (its at about 1138):

SPX 60 min time and price chart:


Now, on the bullish count, it doesn't mean that we won't just continue to crawl up the underside of the midline of the channel to make wave [5], but if it does that, it would probably be a clue that such a rally is likely terminal.

So far, the indicators don't seem overly impressed with the move from the low. The RSI and CCI look like they're just retesting the 50 and +100 lines from which they broke down. The MACD may be turning up, but if so, its doing it very slowly. The histogram is making higher lows within the current trough but is yet to turn positive. The stochastic has moved up from oversold, but hasn't, so far, been able to reach the 50 line.

Of course, all of this can change and the indicators can start behaving more bullishly if we just continue to rally. So, we can only watch the price levels that the move so far suggests should be important to the bullish or bearish counts and wait for price action to confirm which of the two is playing out. On my counts (see the last post) I'm watching 1127.66 and, of course, taking out the high at 1144.38 will void my bearish count.

17:09 BST - SPX update on the bullish an bearish counts

On this bullish count, it looks like we need another leg up to complete wave (1) of [5]. If the labelling is correct, and we're in 4 of (1), we have to stay above the high of 1 of (1) at 1127.66 in an assumed wave 4 correction:

SPX 1 min - one more high to come:


The same count for the move up from today's low could be applied to the bearish count, so one more high needed to complete wave c of 2 (see the second chart in the last post). However, its possible that wave 2 is a w-x-y not an a-b-c and that y of 2 is complete with the move up from today's low being a complete zig zag:

SPX 1 min - top in at 1148.59:


If we take out the high at 1127.66 mentioned above under the bullish count, before making a hig habove 1136.77, then this count will become the most likely.

15:56 BST - SPX Update: Close ups of the bullish and bearish counts

Here's a close up of the chart shown in the previous post:

SPX 1 min - one more high to come close up:


But this is how I'd count it for the more bearish case which assumes a high was put in at 1148.59:

SPX 1 min - (1)-(2)-1-2 down with 2 as an expanded flat:


On this count, if c of 2 fails to take out the a of 2 high, it would be a running flat rather than an expanded flat. 

I can see 5 waves up from today's low, but it may be a (1)-(2)-1-2-3. If we drop below 1131.04 before making another high, the latter will be eliminated so we'll be left with 5 waves up. We'd then need to see today's low taken out if this bearish count is in play. Until then, the buliish count would seem more likely.

15:32 BST - SPX Update - one more high to come in the absence of impulsive downward action?

We've taken out one of the downside levels I was watching yesterday, 1131.47, but not the next level at 1119.77 and with price action not behaving overly impulsive to the downside at present, here's the count I think we need to watch for further upside:

SPX 1 min - 5 waves from 1039.70 still in progress:


On this count, if we're in wave [4] of v, all we have to do is stay above 1110.27 and make a new high and put in 5 waves up from the wave [4] low to complete 5 waves up from 1039.70.

13:48 BST FTSE and Dax breakdown from time and price channels

The FTSE and Dax have broken down out of their 60 min time and price channels:

FTSE 60 min time and price chart:


Dax 60 min time and price chart:


Hopefully we're not just going to get an immediate recovery back into the channels. Assuming its a genuine breakdown, let's see if the SPX can follow suit today.

12:06 BST - SPX Update: Equity Put/Call Ratio, Percent of Stocks above the 50ma and the 60 min time and price chart - lining up for sell signals

The CBOE Equity Put/Call ratio is once again, on the verge of giving a sell signal by the 5ma moving above the 10ma. There hasn't yet been a cross of the 5ma above the 10ma - they closed yesterday at the same level - exactly as they did on 10 September (see my post of 12 September). Then, no signal came as the 5ma dropped below the 10ma and they both stayed below the blue dotted line. Here's the updated chart:

CBOE Equity Put/Call ratio:


As I've mentioned before and reiterated in the 12 September post, we may get the cross of the 5ma above the 10ma and that can be taken as a sell signal, but while these moving averges are below the blue dotted line, there is always a higher risk of false signals, so trade management must take that into account.

There are however, features that might provide some support for a sell signal here. 

First, while the market has risen, the moving averages have stayed within the pink channel, which is presently a smaller downward channel (bullish for the market) within a larger upward channel (bearish for the market). The pink channel looks like a bull flag which should break to the upside (which is bearish for the market). The black channel was broken, but that may just need to be re-drawn. Importantly, so far, the red channel remains intact.

Second, the 5ma has formed a double bottom - you'll see that the 5ma made a triple bottom in early August (see the last vertical red dotted line marking the 9 August market high) and we then saw quite a substantial decline in the market.

Third, there is good divergence in the McLellan Oscillator which made a lower high while the market moved to a higher high. We didn't have this on 10 September (you'll see that we did have such divergence coupled with a cross of the 5ma above the 10ma at the 9 August market high).

If the market has topped, we should see the 5ma cross above 10ma and both should move emphatically above the pink channel and the blue dotted line and, preferably above the mid-line of the red channel. If one or other of these does not happen, it should be considered as a warning that any down move may not be sustainable.

The S&P 500 percent of stocks above their 50ma was in an area where it could have signalled a market top when I last posted it on 12 September, but, as mentioned in that post, there was no sell signal at that time and the risk remained to the upside. 

Since then, it moved up further along with the 13ma (and the market). Its now close to giving a sell signal, but hasn't yet done so. Its reached the overbought area where market tops have occurred previously and has truned down, but hasn't yet crossed down through the 13ma:

S&P 500 Percent of Stocks above the 50ma:


Whereas on 12 September this was telling me to be on the lookout for a potential market top, I think it may now be saying to be on high alert. 

Of course, there's nothing wrong taking trades in anticipation of a sell signal being given here, based on other analysis (eg elliott wave counts or other technical indicators), as long as risk is managed appropriately - its feasible that this indicator could move up again and make a lower high, while the market moves up to a higher high - that has certainly happened at previous market tops. 

If you were only trading off this indicator however, you'd wait for the cross and,  in general, once it falls below the 13ma in this area, its been a fairly reliable sell signal. So, something to keep a close eye on.

The 60 min time and price chart that I last posted on 21 September is aligning well with the potential sell signals referred to above:

SPX 60 min time and price chart:


You can see we're right at one of the time cycle lines so, while not guaranteed, there should be a good chance of a turn around the area of this line. Certainly, the longer term time cycle posted on 15 September would be consistent with a turn here and what we're seeing in the internals and indicators suggests that the turn should be down. 

However, none of these cycles can be precise turning points on every occasion, so more upside remains feasible and a turn down right now shouldn't be considered as guaranteed. Price action needs to be watched closely because sometimes, all you get is a brief pause in the prior trend and the market then continues in its original direction  (currently up) into the next cycle line.

So, looking at price action, it does seem to be behaving like it may now be struggling to make further upside to the next price level at about 1156. Once it fell below the current price level yesterday, it wasn't able to get back above it. 

It also fell below the midline of the channel (the construction of which is explained in the earlier post). Its the first time its done that since the big rally that got it into the upper part of the channel on 1 September. Obviously, this may be a false breakdown, so a quick recovery back into the upper half of the channel would potentially be bullish and we'd have to be thinking that the next price level up may be on the cards. 

However, if it fails to recover the upper half of the channel, that's going to look bearish and will suggest that the lower line of the channel may be reached and that will then open up the possibility of a breakdown out of the channel altogether.

You'll see that I've added some red dotted horizontal lines to the chart. These are Gann based price levels assuming a top at 1148.59. The first one has already been reached (it coincided with prior peaks in the market so was bound to provide support).  The lower ones may be the initial targets to watch for if we have topped and areas where price may pause. If we're only correcting an overall uptrend these levels may mark potential turning points for such a correction. If we're now entering a larger downtrend, these levels should only provide temporary support.

As for the technical indicators, while the bearish divergences did manifest themselves in lower prices yesterday, I really want to see more bearish moves in these indicators to have confidence that we will be seeing at least a reasonable pullback in the market.

The RSI needs to break the 50 level and get to oversold with price declining. The CCI needs to get to below zero and towards the -100 level with price declining. The MACD needs to fall below zero with price declining. The stochastic has reached oversold, but without too much of a sell-off in the market. If we see a market decline today, I'd like to see this indicator fall further into oversold without recovering above the oversold line.

So, the way things are lining up suggests that a top for the rally from the August low may be very near, if not already in at 1148.56. This is consistent with the wave counts, even on the overall bullish case (see yesterday's end of day update). Now we just need price to confirm with follow through to the last two day's bearish candles with a significant deline that takes out some meaningful price levels  to the downside (the ones I'm watching for the moment are set out in that end of day update).
 

Wednesday, 22 September 2010

21:19 BST - SPX End of Day Update

On the 3 bullish to bearish Options set out in Friday's end of day update, the question remains whether or not we've seen the completion of 5 waves or a diagonal up from the August low at yesterday's high of 1148.59  (the diagonal would be an ending or leading diagonal, depending on which of the Options you're looking at). 

Please refer to the 60 min charts in Friday's end of day update for context (the following charts are based on the bearish count shown in Option 1 in that update).

I'll show the possible counts on the chart of the 5 wave impulse from the August low, but if the ending diagonal is complete, the count for the move down from 1148.59 shown in chart 1 below will apply to that also. These are close up charts - for a wider view, please see the charts in yesterday's end of day update:

Chart 1: SPX 1 min - top is in at 1148.59 - impulse/correction down has started:


The labelling relates to the bearish count shown in Option 1 in last Friday's end of day update. Although I've labelled it as if we've only completed wave (i) of [c], given how far we've come, I'm more inclined to think that the rally since August is the whole of [c], so the end of minor wave 2.

This count assumes that the rally from the August low has topped and that we are now going to see at least a reasonable decline. 

On the bearish counts (Options 1 and 2 in last Friday's end of day update) this move down wave would be the early stages of wave [1] down. We should eventually be headed down below the August low (on Option 1 I'm assuming that the high at 1148.59 is the end of wave [c], not just part of it, as mentioned above).

On the bullish count (Option 3 in that update) this move down would be wave (a) or (w) of [ii] down and we're only going to retrace a portion of the rally. Wave (a) may take the form of 5 waves, or it may just form 3 waves. Wave (w) would be 3 waves. Since we have 3 waves down from 1148.59 to 1131.58, its possible that that low marks the end of wave (a) or (w) of [ii]. If its (a), then wave (b) will have to retrace at least 90% of the decline since 3 waves for (a) means a flat is forming. If its (w), then the move up from 1131.58 would be wave (x) and can take any corrective form and doesn't have to retrace any particular amount.

For the bearish count, or if we're forming 5 waves for (a) of [ii] on the bullish count, the labelling on chart 1 will have to be revised if we take out the high at 1144.38 in this assumed wave 2 of (3) retracement (and, of course, it'll be invalidated altogether above 1148.59). Although I've labelled wave 2 of (3) as complete, it may not be since its quite shallow for a second wave, so further upside is possible as long as it stays below that wave (2) high.

However, once complete, if we're seeing an impulse wave down from 1148.59, then I want to see a swift move to below 1131.47 and then below the wave [4] low at 1119.77.


Chart 2: SPX 1 min - final leg of the rally still to come:


Here, I'm assuming that the high at 1148.59 was wave X in an expanded type correction for wave (4) of [5], so there is still one more high to come before the rally from the August low is complete. 

This count will be invalidated if we take out the high of wave (1) of [5] at 1131.47 without making 5 waves up from wave (4) and/or a new high first.

So, after today's action, the levels I'm watching are 1148.59, 1144.38, 1131.47, then 1119.77.

19:55 BST - SPX Update: on the immediately bearish count, impulse down from 1148.59 in progress

Referring to the two bearish counts in my last post, I don't like the fact that we took out the low of the diagonals in what's meant to be wave (2) or 2. It doesn't break any rules, but I'm thinking this may be the better count for the move from the high at 1148.59 (the chart is slightly different from the charts I've been showing for the 5 waves up from the August low - its from Friday's end of day update and on this one, wave [4] isn't a triangle, but otherwise, its no different from the previous chart):

SPX 1 min - impulse down from 1148.59 in progress:


At the high of 1137.23, c=a so if this count is right, it could be done now. This count will be invalidated if we take out the high at 1144.38.

17:24 BST - SPX Update: Possibilities from the 1148.59 high

For the immediately bearish case, the move down from 1148.59 can be counted as a leading diagonal wave (1). However, it could be a C wave within wave (4) on the alternate (the wave (4) of [5] possibility just managed to survive this morning's decline). 

There's another possibility, which is that waves (1) and (2) are where I placed them in my first post and there was then a diagonal for 1 of (3) to today's low (see the dotted lines). That's negated above 1144.38:

SPX 1 min - top in at 1148.59 or one more high to come:


Levels I'm watching: 1144.38 to negate the (1)-(2)-1 count;1148.59 to negate the wave (1) down count; and 1131.47 to negate the wave (4) of [5] count.

15:13 BST - SPX Update: possible (1)-(2) down from 1148.59

With the rally from yesterday's late low looking like 3 waves, here's a provisional labelling which assumes that yesterday's high was the top of the rally from August, but the alternate count remains a possibility until we take out 1131.47 without making a new high first (wave (4) may have formed or be forming a triangle (see blue dotted lines) - this will be eliminated if we drop below 1136.22):

SPX 1 min - possible (1)-(2) down from 1148.59:

12:26 BST - Dollar Update

The dollar failed to hold the low at 80.085 so confirming that wave (2) of intermediate [3] up on the bullish case, isn't yet over. The count that I've been showing as an alternate is now the main count and puts us currently in wave C of (2) on the bearish case:

Dollar 75 min:


You can see that I've labelled it as if we're only in [i] of C at the moment. That might be too pessimistic, but a better time to judge will be once we have 5 waves down from the B wave high complete. At the moment, the decline from wave B isn' t quite 0.5 x wave A. It would be at about 79.200. If it gets there, or, better still, to the 0.618 x wave A at about 78.191 in 5 waves, that would look quite good for the whole of wave C.

I've also noted the alternative on the chart, which I mentioned in yesterday's update which is that the decline from where I have labelled wave B is actually only wave [b] of B, (in the form of a double zig zag) so we'd next get a rally in wave [c] of b.

Here's a close up from the wave B high:

Dollar 60 min:


Once we've completed wave (iii) of [i] of C down (if its not yet complete), then we should get a rally of sorts in wave (iv), perhaps to the 38.2% retracement level at arounf 81.100. 

Anything much above that, especially if we break impulsively above the wave iv triangle and that area of congestion becomes support, would start to suggest that the alternative labelled may be playing out. The other alternative would be  that we completed wave C (the latter would involve some relabelling since currently the labelling assumes we haven't seen a complete impulse wave down from the B wave high - the best solution may then be to label the decline from (1) to A shown on the 75 min chart as 3 waves for wave W, followed by wave X and then 3 waves for wave Y).

Tuesday, 21 September 2010

23;40 BST - Dollar Update

The dollar's not looking too good on the count that has it in intermediate wave (3) up. Today it has come very close to the low that I have labelled as wave (2) on the bullish count, as you can see from this75 min chart:

Dollar 75 min:


The alternate shown on the chart (its the first of the alternates I've had listed on the dollar page) implies alot more downside to come if that low at 80.085 doesn't hold.

Here's a closer look at how it may be counted on the bearish count:

Dollar 60 min:


If I count wave (E) of the triangle [B] wave as a triangle itself, then wave [C] of y looks like it might need one more low to complete. Its feasible that it could do that without breaching the 80.085 low, so this may be the best count for the bear case at the moment (unless the low is already in, of course).

If it can hold that low and take out 82.780, there's a reasonable chance that it'll go on to take out the high at 83.522. Whether that will be within the context of wave (3) up or whether it will still be the B wave on the alternate count, we'll have to wait and see as price action develops.

22:29 BST - SPX: 60 min time and price chart

This chart shows Gann based price levels from the 1040 low with a 4 day cycle and a channel with a lower line drawn through the first cross of the time and price lines after the start point of the channel at the 1039.70 low:

SPX 60 min time and price:


Its interesting how price has found resistance and support at these price levels and how, at the 1121 level it consolidated for so long right between two of the time cycle lines before this latest rally (see the yellow highlighted areas). 

The close today was right on one of those price levels. I've marked the next level up, which is at 1156 (the one after that is about 1173, but won't fit on the chart).

Its obviously well within the realms of possibility that the market could get to the next price level. I showed in the end of day update a possible count that has us still in wave (4) of [5] of an impulse up from the August low (see the fourth chart). Today's high would have been wave B of wave (4) which is forming an expanded flat on this alternate count. So, wave (5) of [5] would follow once wave C of (4) is complete.

As mentioned in the update, if that count is playing out, we'd have to stay above the wave (1) of [5] high at 1131.47 in wave (4). As long as we do that, the risk of a further high, possibly to the next price level shown on the above chart (or the next one at 1173), remains.

You can see from the chart how well price has moved within the upper half of the channel. So, a break down into the lower half may be an indication that the rally is over. A break down out of the channel altogether would probably confirm a top of some sort is in.

The next time line on the chart is tomorrow. This coincides with two cycles I showed last week which start from the March 2000 high - see that post here.

The RSI, MACD and MACD histogram show nice divergences. The MACD and its histogram show quite a large one going back to early September. The histogram and the RSI show nice divergences between yesterday's and today's highs. 

Its perfectly possible in light of this and the main wave counts shown, that the rally ended at today's high. However, if a top is in, we need to see the indicators move to bearish levels with a decline in price. Anything less than that (for example, the indicators fall away but price is only moving sideways) should be considered as a warning that further upside may be coming.

21:09 BST - SPX End of Day Update

On the 3 bullish to bearish Options set out in Friday's end of day update, its possible that we have seen the completion of 5 waves or a diagonal up from the August low at today's high of 1148.59  (the diagonal would be an ending or leading diagonal, depending on which of the Options you're looking at). 

Please refer to the 60 min charts in Friday's end of day update for context (the following charts are based on the bearish count shown in Option 1 in that update).

Here's the ending diagonal count:

SPX 1 min - diagonal from August low:


For this count we had to stay below 1150.84 in wave (v), which we did, so, assuming its complete, it remains valid.

Here's a close up:

SPX 1 min - diagonal from August low close up:


If its complete, a swift move below 1114.63, the wave (iv) low should be on the cards to start with and it should do it in a clear and impulsive manner. If  it doesn't behave in that way and/or fails to take out that low, I'd be suspicious that something else may be playing out, which might involve more upside.  

Here's the impulse wave count (these again use the count in Option 1  from Friday's end of day update, but assume that the rally from August is only wave (i) of [c] - I think that may now be unlikely and that its more probably all of [c] on this Option):

SPX 1 min - 5 wave impulse from August low:


The alternate that I posted this morning played out, with a further high. It now counts well as complete at today's high. However, I think it needs to drop below the low at wave [4] at 1119.77 to confirm. Having said that, I'm looking at the high at 1131.47 as an initial signal that its complete, since taking that out would preclude the possibility that wave (4) of [5] is forming an expanded flat.

Here's a close up:

SPX 1 min - 5 wave impulse from August low close up:


Whichever of these two counts represents what we have seen from the August low, if we have completed a rally from that low, we now have to see what kind of pullback we get in order to try to determine what that rally represented - whether it was a final rally before a larger move down (as suggested by Options 1 and 2 in Friday's end of day update) or if its just a temporary high which will be taken out, probably within the next few weeks, as the market moves to the April high and above (as suggested by Option 3 in Friday's end of day update).

We can't know which it'll be at this stage. The more impulsive any pullback is and the further down it gets, the more likely it will be that one of the bearish Options (1 or 2) is playing out. However, this will really only become likely if we take out the low at 1039.70 and then only confirmed if we take out the low at 1010.91. There's plenty of trading between where we are now and those levels, so all we can do is monitor and assess as price action develops.


For the moment,  I'm watching 1131.47, then 1119.77 and 1114.63 and if they're taken out, I want to see it happen with a clearly impulsive move.

18:47 BST - SPX Update: 5 waves down from 1144.86?

Its possible we've had 5 waves down, but its possible also to count it as corrective - its certainly moved like a corrective wave rather than an impulse:

SPX 1 min - 5 waves down from 1144.86?


I've labelled a possible ending diagonal for wave 5, but it could develop into an impulse if things are really getting bearish.

If we've had 5 waves down for the start of a larger down move, obviously, we have to stay below 1144.86 on the next move back up. If we're in wave (4) of [5] up, we need to stay above the wave (1) of [5] high at 1131.47.

16:30 BST - NYSE Tick bearish divergence against SPX highs

This divergence between the price action and the NYSE Tick occuring in an overbought area seems to be supporting a pullback of some sort in the market:

NYSE Tick:


We saw a divergence in the Mclellan Oscillator yesterday too. So maybe things are starting to at least line up for a reasonable pullback (if not the start of a larger move down).

15:38 BST - SPX Update: 5 waves up complete or one more high to come?

Its possible we've seen the end of 5 waves up from the August low, but the drop from yesterday's high doesn't look overly impulsive, although it is possible to count it as 5 waves down with a sideways correction now in progress. However, the alternate count on this chart (which I mentioned yesterday) suggests a further high might yet be needed:

SPX 1 min - 5 waves up complete, or one more high to come?


Unfortunately, I can't rule out the alternate unless we take out 1131.47 without making a new high first.

Monday, 20 September 2010

21:23 BST - SPX End of Day Update

On the 3 bullish to bearish Options set out in Friday's end of day update, the wait for a top to the rally from the August low continues, as was the risk with the market failing to take out any significant level to the downside.

For the move off the August low I'm counting either a diagonal (ending or leading, depending on which of the Options you're looking at) or a 5 wave impulse.  Please refer to the 60 min charts in Friday's end of day update for context (the following charts are based on the bearish count shown in Option 1 in that update).

Here's the ending diagonal count:

SPX 1 min - diagonal from August low:


This count suggests we're now in the final throes of the diagonal, assuming its not complete at today's high, whether you use the labels on this chart or the alternate labels shown on the chart below. It would be an ending diagonal for the bearish count shown in Option 1.

Here's a close up:

SPX 1 min - diagonal from August low close up:


Remember, the diagonal count I've labelled is invalid if this latest leg up exceeds 1150.84. To the downside, I'll be watching 1134.81, which would be a sign that the rally, if it was a diagonal, is over. However, I'd be a bit more confident that it had ended if we take out the low at 1123.97.

Still, with the bullish count shown shown as Option 3 in Friday's end of day update, there's always going to be a risk of further upside. On that count, this diagonal would be a leading diagonal. While we might expect a good retracement if it is, it would then be followed by new highs. This would be considerably less likely only if we take out 1039.70.

Here's the impulse wave count (these again use the count in Option 1  from Friday's end of day update, but assume that the rally from August is only wave (i) of [c] - I think that may now be unlikely and that its more probably all of [c] on this Option):

SPX 1 min - 5 wave impulse from August low:


Again, this is looking like it could be near completion, if not complete at today's high. You can see from the note on the chart that we've reached the point where wave v is a 1.618 extension of wave i in this rally. We've also reached the 61.8% retracement level of the decline from the April high.

Here's a close up:

SPX 1 min - 5 wave impulse from August low close up:


On this labelling, I'm looking at the low of 1119.77 as the level to watch for confirmation that a top is likely in. Until then, the 5 waves up that I've labelled from there could just be the first in a larger 5 wave move up. 

However, even if we take out that level, given the bullish count (see Option 3 in Friday's end of day update) regard must be had to the continuing possibility of further highs - as mentioned above, we'd have to take out the low at 1039.70 to start to think that the bullish option may not be playing out.

So, those are the levels I'm watching on the labelling I've applied to the move from the August low. Since a decline would be due whether the bullish or bearish Options are playing out, it can't be assumed that a top is the end of any further upside. As stated in previous updates, until we see price action which is consistent with a major top having been made, in one of the bearish Options (1 or 2 in Friday's end of day update) and which takes out significant levels,  the risk remains to the upside.


17:13 BST - SPX Update: 5 waves complete or nearly complete for (3) of [5] or the completion of an ending diagonal?

On both counts shown in the last two posts, I'm looking for 5 waves up from 1123.97. It may have completed at 1138.54, but there's possibly still one more high needed as shown on this chart of the ending diagonal:

SPX 1 min - ending diagonal complete or nearly complete:


At today's high, wave [C] of y is about 1.236 x wave [A].

If we have completed 5 waves up at 1138.54 then taking out 1131.47 or, as explained in the last post, 1128.12, would certainly help to increase confidence in a top of some sort, perhaps the completion of the ending diagonal. That would be confirmed as complete on this labelling if we drop below the low of wave iv at 1114.63.

16:00 BST - SPX Update: Less bearish count

This count from chart 4 in Thursday's end of day update has more bullish potential than the ending diagonal shown in the previous post:

SPX 1 min - wave [5] of v up in progress:


And here's a close up:


If we're in wave (3) of [5], then the next pullback in wave (4) would need to stay above the wave (1) high at 1131.47. However, if wave (2) is actually the low at 1122.43 and 1128.12 is actually wave 1 of (3), then the next pullback would be 4 of (3) and would have to stay above 1128.12.

Obviously, those extensions listed for wave v on the first chart above may not limit it.

115:25 BST - SPX Update: ending diagonal becomes the most bearish count

So, with the high at 1131.47 gone, this is now the most bearish count - the ending diagonal in its final wave. It has to stay below 1150.84, as mentioned in Friday's end of day update, on this leg to remain valid assuming the labels are in the right place:

SPX 1 min - ending diagonal:

15:04 BST - SPX Update on the bearish counts

Here's the immediately bearish count, calling for a decline now - its invalidated above 1131.47 and that could happen very quickly:

SPX 1 min - top in at 1131.47:


Taking out 1123.97 would help this count, but 1118.88 remains the focus for the bear case for now.

Otherwise, a further high in the ending diagonal count shown as an alternate on the following chart may be likely:

SPX 1 min - ending diagonal: