
On the 3 bullish to bearish Options set out in Friday's end of day update, its possible that we have seen the completion of 5 waves or a diagonal up from the August low at today's high of 1148.59 (the diagonal would be an ending or leading diagonal, depending on which of the Options you're looking at).
Please refer to the 60 min charts in Friday's end of day update for context (the following charts are based on the bearish count shown in Option 1 in that update).
Please refer to the 60 min charts in Friday's end of day update for context (the following charts are based on the bearish count shown in Option 1 in that update).
Here's the ending diagonal count:
SPX 1 min - diagonal from August low:
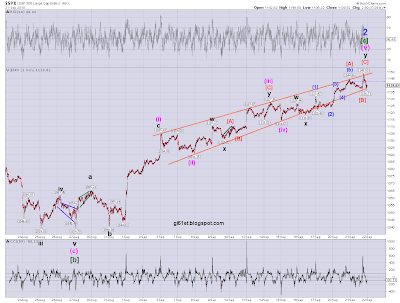

For this count we had to stay below 1150.84 in wave (v), which we did, so, assuming its complete, it remains valid.
Here's a close up:
SPX 1 min - diagonal from August low close up:

If its complete, a swift move below 1114.63, the wave (iv) low should be on the cards to start with and it should do it in a clear and impulsive manner. If it doesn't behave in that way and/or fails to take out that low, I'd be suspicious that something else may be playing out, which might involve more upside.
If its complete, a swift move below 1114.63, the wave (iv) low should be on the cards to start with and it should do it in a clear and impulsive manner. If it doesn't behave in that way and/or fails to take out that low, I'd be suspicious that something else may be playing out, which might involve more upside.
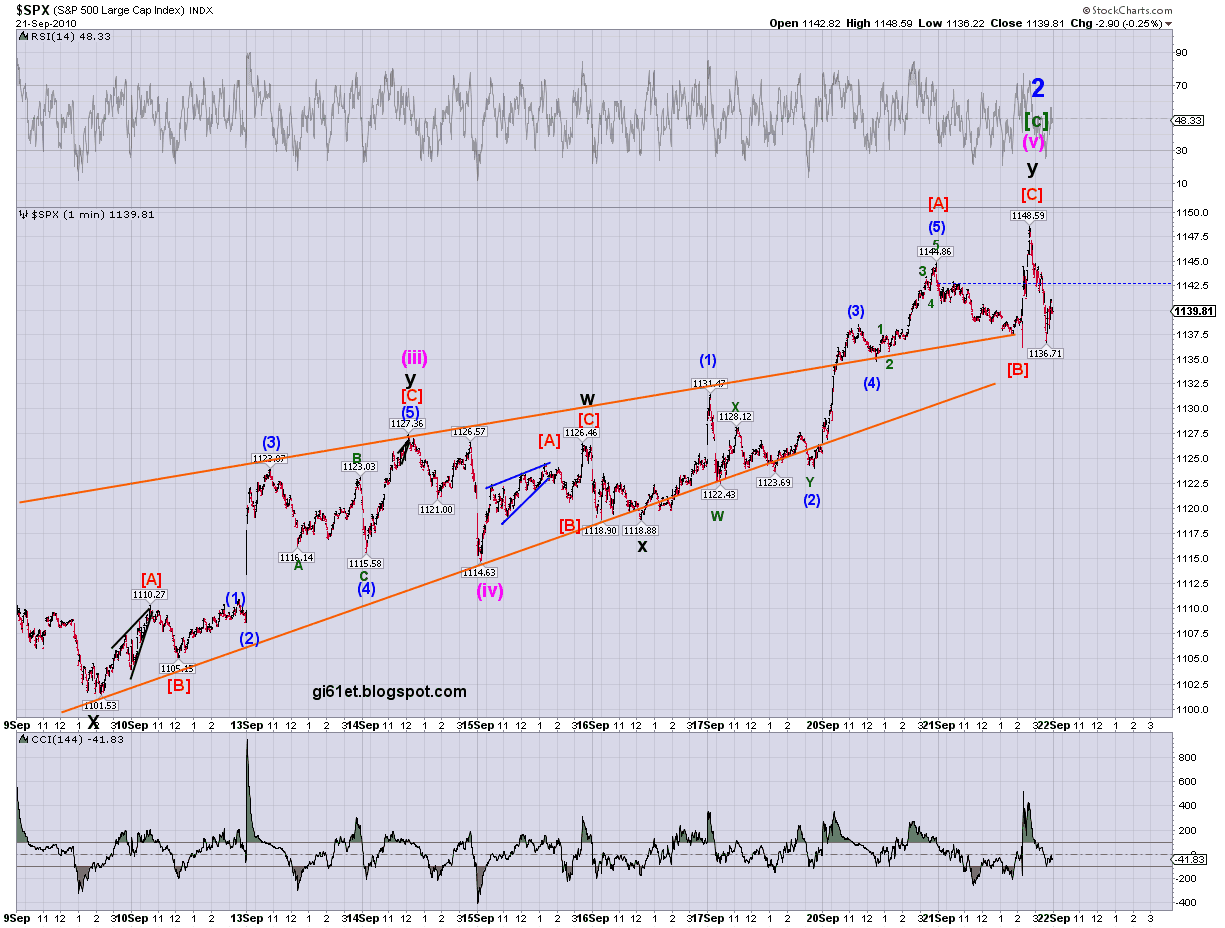
Here's the impulse wave count (these again use the count in Option 1 from Friday's end of day update, but assume that the rally from August is only wave (i) of [c] - I think that may now be unlikely and that its more probably all of [c] on this Option):
SPX 1 min - 5 wave impulse from August low:

The alternate that I posted this morning played out, with a further high. It now counts well as complete at today's high. However, I think it needs to drop below the low at wave [4] at 1119.77 to confirm. Having said that, I'm looking at the high at 1131.47 as an initial signal that its complete, since taking that out would preclude the possibility that wave (4) of [5] is forming an expanded flat.

The alternate that I posted this morning played out, with a further high. It now counts well as complete at today's high. However, I think it needs to drop below the low at wave [4] at 1119.77 to confirm. Having said that, I'm looking at the high at 1131.47 as an initial signal that its complete, since taking that out would preclude the possibility that wave (4) of [5] is forming an expanded flat.
Here's a close up:
SPX 1 min - 5 wave impulse from August low close up:

Whichever of these two counts represents what we have seen from the August low, if we have completed a rally from that low, we now have to see what kind of pullback we get in order to try to determine what that rally represented - whether it was a final rally before a larger move down (as suggested by Options 1 and 2 in Friday's end of day update) or if its just a temporary high which will be taken out, probably within the next few weeks, as the market moves to the April high and above (as suggested by Option 3 in Friday's end of day update).

Whichever of these two counts represents what we have seen from the August low, if we have completed a rally from that low, we now have to see what kind of pullback we get in order to try to determine what that rally represented - whether it was a final rally before a larger move down (as suggested by Options 1 and 2 in Friday's end of day update) or if its just a temporary high which will be taken out, probably within the next few weeks, as the market moves to the April high and above (as suggested by Option 3 in Friday's end of day update).
We can't know which it'll be at this stage. The more impulsive any pullback is and the further down it gets, the more likely it will be that one of the bearish Options (1 or 2) is playing out. However, this will really only become likely if we take out the low at 1039.70 and then only confirmed if we take out the low at 1010.91. There's plenty of trading between where we are now and those levels, so all we can do is monitor and assess as price action develops.
For the moment, I'm watching 1131.47, then 1119.77 and 1114.63 and if they're taken out, I want to see it happen with a clearly impulsive move.