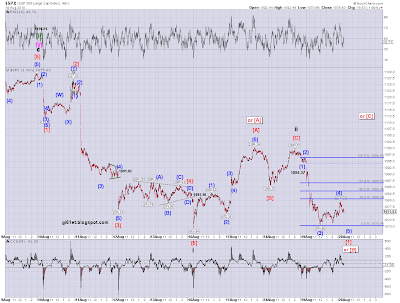
From my previous posts you'll see that on the bearish counts, I'm looking at a 5 wave decline from the high at 1129.24, representing a 1st wave down, followed by a 3 wave pullback for a 2nd wave retracement, whether the 1st wave ended at 1176.69 or at 1069.49. You can see the earlier post here.
To put these counts in context, please see the 60 min counts page which explains the counts I'm following and what the labelling in the shorter term charts I look at day to day means in the context of each of those counts.
So, for those bearish counts, here's how we ended up today:
SPX 1 min from the high at 1129.24:
SPX 1 min from the high at 1129.24:
This chart uses the labels and degrees relating to Option 2, but relates to the bearish counts for all the Options referred to on the 60 min counts page.
So, from the 1129.24 high, I'm counting a i down and ii up. The alternate labels on the chart relate to the chart I posted earlier which allows for one more push up to complete wave ii - see the post here.
Obviously, we can't know whether or not that further push up is going to happen. We can only watch the rallies we get and monitor them for clues as to whether or not they will turn into something impulsive looking enough to be a [C] wave. For the immediately bearish case, we're looking for a 3 wave rally that ends somewhere in the region of a 50% retracement once we've completed 5 waves down from the wave ii high.
For the moment, I have us still needing a wave (5) to complete wave [1] down. Here's the count close up (I've changed the degrees from the charts posted earlier today to match the degrees in the first chart above):
SPX 1 min close up:
If that's the correct labelling, we need to stay below the wave (1) low on this wave (4) retracement. That low is 1094.37. However, it really wouldn't look like a 4th wave if it got that high. I think if we retrace much more than above the 50% level at about 1083, I'd start thinking that we had already seen 5 waves down to complete wave [1] at the low of 1070.66 (I mentioned this as a possibility in earlier posts today) and that we were now in a wave [2] retracement. If its wave (4) then the retracement we've seen this afternoon to about the 38.2% level would be a perfect place for this wave (4) to end.
If its a wave [2] retracement, ideally it won't get too much above a 50% retracement (that would be at about 1085), but as we know 2nd waves can retrace more. Ultimately, the level to watch would be the high of wave ii at 1099.77 since taking that out would invalidate this labelling.
However, the alternate labelling would still be in play, which would make the rally from the low at 1070.66 wave [C] of ii. We would then look for an impulsive decline to take out the 1077.66 low to gain some confidence that the alternate bearish count on the above chart was playing out and not something more bullish.
Speaking of the bullish counts, the first one shown in last night's update (see here) has been pretty much invalidated. However, because we haven't taken out the low at 1069.49, technically, the labelling on the chart of the second bullish alternate shown in that update is still valid. I've left that labelling on the chart of the second bullish alternate below, but shown a revised labelling on the chart of the first bullish alternate:
SPX 1 min - first bullish alternate under option 4 - impulse up from 1010.91:
As shown on the chart, this count remains in play as long as we stay above 1056.88 on this alternate. That's the low of wave [ii] of the impulse up from 1010.91. You can see it on the 1 min chart of this alternate under Option 4 on the 60 min counts page.
SPX 60 min - second bullish alternate under Option 4 - leading diagonal up from 1010.91:
Given the depth of the retracement in wave [ii] of C, this count seems unlikely, but if that 1069.49 low holds, its valid. If we take out that low, we could still be in wave B and that will apply until we take out the low of 1010.91.
So, for the bearish count, if we had a wave (4) retracement this afternoon, we want to see a move to new lows below 1070.66 and, of course, 1069.49. If we're in a wave [2] retracement up from 1070.66, ideally, we won't get much above 1085. If we take out the 1099.77 high, focus would switch to the alternate count shown for the bear case and we would look for a 5 wave rally from 1070.66 to be followed by impulsive declines that take out the 1070.66 low soon after that.
If we take out 1056.88 to the downside, the first bullish alternate will be invalidated. However, the second bullish alternate will remain in play until we take out 1010.91.


