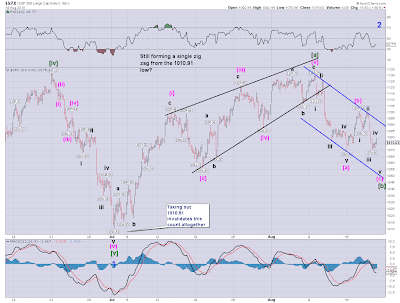
Here is something to watch out for because even for the bearish Options, it would mean some potentially significant upside to come first, likely above the highs of 1129.24 and 1131.23. I've put it on the chart of Option 3 because I think it looks best on that chart, but it could also apply to all of the bearish Options (see the 60 min counts page for those Options):
SPX 60 min - still in a single zig zag from 1010.91:
As you can see, it takes the leading diagonal count for the move up from 1010.91 which I've been showing on the second bullish alternate count under Option 4 and labels it as wave [a] of a zig zag up from 1010.91. The decline from there would be wave [b], leaving a 5 wave rally in wave [c] yet to come.
With this count looking not unreasonable, once we've had a 5-3-5 down from 1129.24, we'll have to be alert to the possibility that the next move up could be wave [c] of this zig zag, taking us to new highs for this move up from 1010.91.
On the labelling I've shown, we only need one more low, preferably below 1070.66, to complete a 5-3-5 move. So, we'll then need to watch the retracement from there carefully for any clues that this count may be playing out.
The problem we have is that even on the bearish counts, we are expecting a new low below 1070.66 and then a rally in a 2nd wave. If that's correct, the high at 1099.77 must hold (that's the start of the 1st wave that we would be retracing on those bearish counts). After seeing 3 waves up from any new low, we'd want to see an immediate impulse wave back down.
However, as the third chart in this post from yesterday shows, even on the bearish counts, we could be in a flat for a 2nd wave of one higher degree so would be expecting a c wave up, probably to above 1099.77 and 1100.14. And, that wave will have to be a 5 wave impulse. So, it won't be easy to tell whether this or the potentially more bullish count in the 60 min chart above is playing out - the more bullish count could see the [c] wave take us to the 78.6% retracement level for the decline from 1219.80, which is at about 1175.
Obviously, there are other tools we can use apart from elliott wave analysis that may help.
I've drawn in a down channel which would be the base channel on the bearish count. If we are in the immediately bearish count, we should accelerate down out of this channel to form a steeper one for wave (iii) on the bearish count. So, a significant break down out of this channel without an immediate recovery should be bearish.
If we stay within this channel for this decline, as a guide, its more likely that the move down within it is corrective. A break above the channel might be a warning that the more bullish count above is playing out. However, if the flat referred to above is in play, we could break above the channel in its c wave, only to fall back within it. So, we'd look for a significant break above and a failure to drop back within it pretty much immediately as an indication that the more bullish count could be playing out.
If we stay within this channel for this decline, as a guide, its more likely that the move down within it is corrective. A break above the channel might be a warning that the more bullish count above is playing out. However, if the flat referred to above is in play, we could break above the channel in its c wave, only to fall back within it. So, we'd look for a significant break above and a failure to drop back within it pretty much immediately as an indication that the more bullish count could be playing out.
I also make alot of use of pitchforks to try to identify trends and turning points for trends. You can see my last post showing the pitchforks I'm watching and what I'd want to see for the bearish case here.
So, as ever, there are no certainties in trading - we just have to be prepared for all eventualities.

