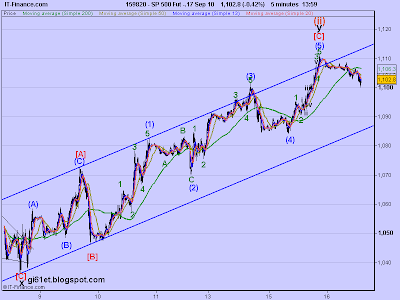
Here's the 5 min chart of ES numbered in accordance with Option 1 on SPX which puts us pretty much at the end of a wave (ii) correction within wave [iii] down. It calls for a drop in (iii) of [iii] soon, if not now.
es 5 min chart;
However, the drop off from yesterday's high in ES could be wave [4] of i of (c) (or wave iv of (c)), which is what I'd be looking for in SPX in Option 2 .
For Option 3 on SPX, we just need to see this drop since a nice double zig zag to complete wave [iv] of the leading diagonal counts as completed yesterday.
Option 4 on SPX also requires a drop soon, assuming a complete a-b-c from the low on 8 June. The drop would be wave [c] of minor Y within an intermediate [X] wave down from 1219.80.
For Option 5 on SPX, we need to see a wave [4] of iii down before a further rally to complete iii of (i) up within a minor wave A rally, so a pullback soon would be fine for this count.

