Menu

Monday, 19 July 2010

21:47 BST - SPX Update

On the counts that imply the rally from the 1 July low is a corrective one (Options 1, 2, 4 and 5) I've labelled completed double/single zig zags ending with a truncation at 1099.08.

On the count that places us in a 5 wave move off the 1 July low (Option 3), which would be part of a larger correction up,  I've labelled the high at 1099.46 as wave (iii) of that advance and the subsequent decline as wave (iv).

The Options are the different ways to count the move down from 1219.80. There are 5 that I'm following and they are set out on the 60 min counts page

Today's action did nothing to answer  the question whether the rally from 1 July has completed a corrective move or whether its only all (or maybe, part) of a larger correction up.

Here's how things stand after today:

Option 1 - Wave (ii) of [iii] topped at 1131.23

15 min chart:


Five waves down from 1131.23 on this Option represents wave i of (iii) of [iii] of minor 1. The double zig zag I have labelled from the 1010.91 low would be wave ii of (iii), so implies a wave iii of (iii) decline to follow.

The 1099.08 high is the invalidation point for the completion of wave ii on the double zig zag as labelled.

I've labelled a (1)-(2)-1-2-i-ii to account for the decline since. The invalidation points are 1079.64, which would eliminate the i-ii, and then 1098.66, which would call into quesion whether we did top at 1099.08.

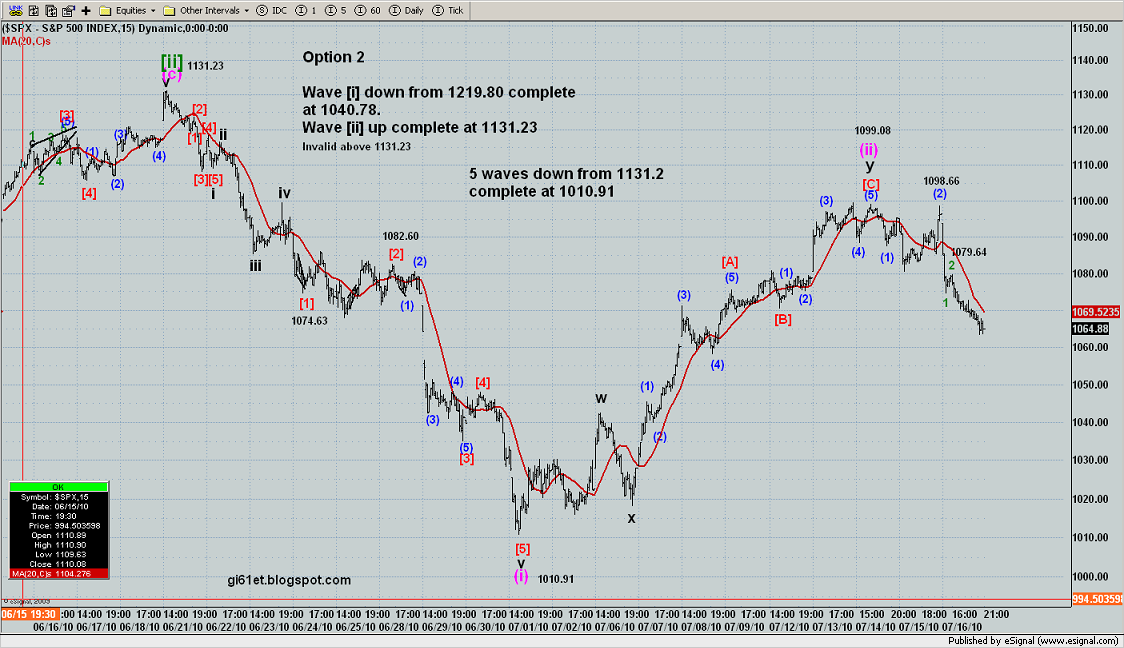
Option 2 - Wave [ii] topped at 1131.23

15 min chart:


For this Option, five waves down from 1131.23 represent wave (i) of [iii] of minor 1 down. The double zig zag up from 1010.91 would be wave (ii) of [iii], so, assuming its complete, we would be in wave (iii) of [iii] down.

This is the same labelling as on the chart of Option 1 for the rally from 1 July and subsequent decline (although the wave degress are different), so the invalidation points are the same.


Option 3 - Wave [iv] of an ending diagonal completed at 1131.23

15 min chart:


For this Option, 5 waves down from 1131.23 to 1010.91 could be  wave [v] of a leading diagonal down from 1219.80 and, therefore, minor wave 1.  

It places us now in minor wave 2 up.  I've labelled the start of 5 waves up from the 1010.91 low, on the assumption that we will get a zig zag type move up for wave 2, since we  would be retracing the whole decline from 1219.80, not just the drop from 1131.23.

I'm showing us having completed wave (iii) (at 1099.46) of what I'm assuming at the moment will be a 5 wave move for wave [a] of minor 2.  This would mean the current pullback should be wave (iv) of [a]. This count would be invalidated if that assumed wave (iv) were to fall below 1028.74, the wave (i) high.

Today's action may have completed wave (iv) - taking out today's low will invalidate that, but it may just mean wave (iv) has a bit more to go.

The alternate labelling assumes that the 5 waves down from 1131.23 is only wave (a) of [v] and that the retracement back up was wave (b). Assuming its complete, we'd now be in wave (c) down and the count shown on the charts of the other Options would likely be in effect.

Remember, if there is further downside  to come, we must stay above 999.83 for the leading diagonal count to remain valid. 

Option 4 - Wave [b] of minor Y within intermediate (X) topped at 1131.23

15 min chart:


For this Option, 5 waves down from 1131.23 would be wave (i) of [c] of minor Y and the double zig zag up from 1010.91 would be wave (ii) of [c].

However, as mentioned previously, counting a complete 5 waves down to 1010.91 does bring in the possibility that wave [c] of Y is done so we have also completed intermediate wave (X) - see the 60 min counts page. That would put us now in a minor wave A rally and eventually take us to new highs. If wave (X) did end at 1010.91, then the impulse wave I have labelled on the chart of Option 3 would apply here.

For the moment, I've assumed we are starting wave (iii) of [c] down with a [1]-[2]-(1)-(2)-1-2 from  the 1099.08 high. The invalidation points are the same as for Options 1 and 2.


Option 5 - Minor wave X within intermediate wave (X) topped at 1131.23. Now in minor Y down

15 min chart:


On this Option, 5 waves down to 1010.91 would be wave [a] of minor Y down and the retracement would be wave [b]. If its over, we would now be headed down again in wave [c] to complete minor Y.

I've labelled a single zig zag on this chart, but its end point is the same as for Options 1, 2 and 4, namely, the high at 1099.08, so that would be the beginning of wave [c]. The same invalidation points stated for  options 1, 2 and 4  apply here.

Here's an update of the chart I posted earlier showing a possible bearish count for today's move. If we continue to retrace up, it may mean that the larger diagonal I showed as an alternate on Friday night may be playing out but for the time being, I'll go with this:

SPX 1 min:


The degree labels used relate to Option 2.  The count shows wave [3] sub dividing into a (1)-(2)-1-2 where wave 1 was a leading diagonal. Wave 2 retraced 70.7% of wave 1, which is deep enough to provide some confirmation that a leading diagonal may be the correct count for wave 1. The count calls for a 3rd of a 3rd wave at several degrees  fairly soon. If that does not happen, its going to call the bearish count into question.

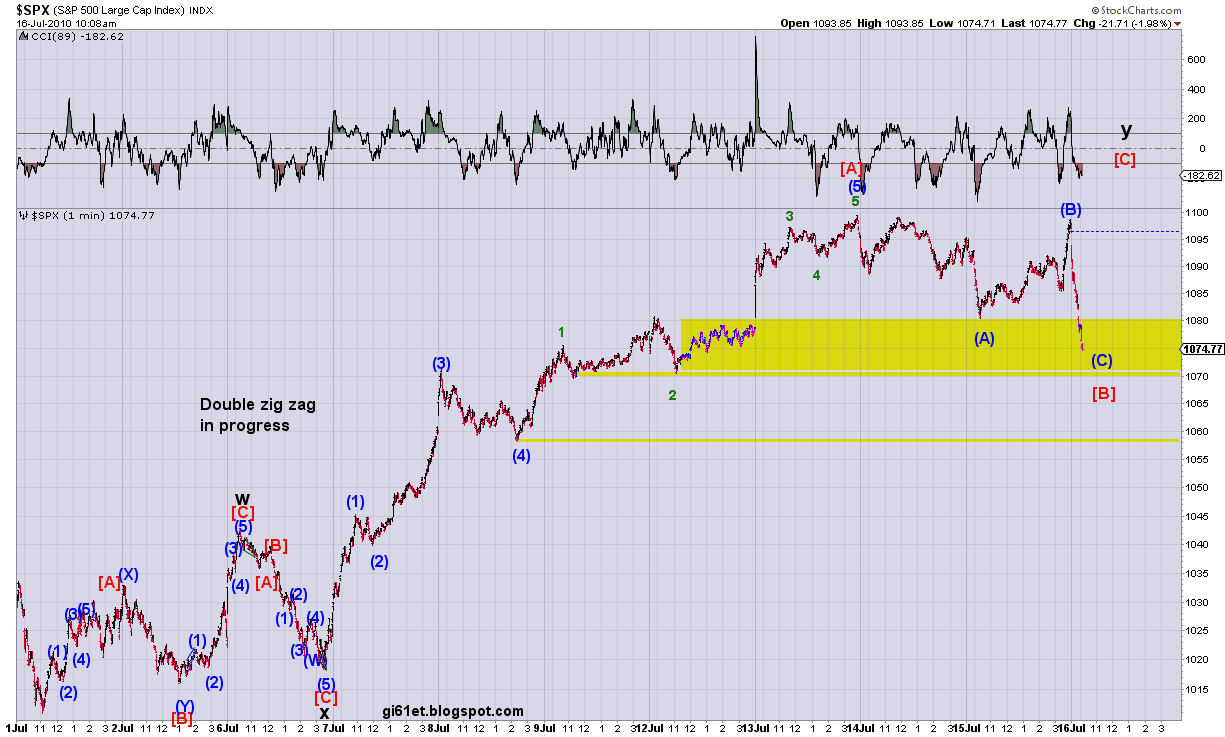
However, if we are in the larger leading diagonal count a deeper retracement up wouldn't be unusual, so while the count shown above would be invalidated above 1079.64, a deeper retracement of a larger leading diagonal would be a continuing possibility for the bearish case. However, we'd still need to watch the 1098.66 high since if that is taken out, the chances are that we are still in a double zig zag correction, as shown on this chart that I've posted previously:

SPX 1 min - double zig zag still in progress:


The other possibility, if 1098.66 is taken out, would be that the count on the chart of Option 3 is playing out, so we would have to expect a substantial rally which would very likely take out the high at 1131.23.

So, the levels to watch haven't really changed from Friday. We'll just have to continue to wait for the market to move decisively one way or another so that at least some possibilities can be excluded.


16:17 BST - SPX Update

The more bullish counts aren't yet off the table:


SPX 1 min - continuing double zig zag:


SPX 1 min - impulse wave up from 1 July:


15:54 BST - SPX Update

Getting closer to that void:

SPX 60 min chart:

15:41 BST - SPX Update

Here's what I'm seeing as a possible count on the bearish scenarios at the moment - a wave (1) down from 1098.66, a wave (2) retrace and then a leading diagonal for wave 1 of (3):

SPX 1 min chart:


We retraced nearly 61.8% of wave 1 which perhaps is deep enough for a retrace of a diagonal if we are in the bearish counts. I prefer this to the larger leading diagonal that I posted on Friday night, but of course, the retracement up may not be complete so we'll just have to see what develops now - it may retrace up enough that the larger leading diagonal looks more likely. 

I'm watching today's highs and the wave (1) low for signals that a higher retacement up may be playing out.

11:04 BST Dollar Update - Some trading examples

On 9 July, I posted a count showing a possible end to the decline in the dollar with what looked like an ending diagonal. It ultimately turned out not to be the case, but as mentioned in my post on 15 July, there was still a profitable long play based on the thought that the low identified on 9 July at 83.622 was possibly the end of the decline.

Indeed, once the long play was over, there were several opportunities to the downside as well.

Here are two 60 min charts covering the period from the 83.622 low to Friday's close which show some very simple trades primarily using the 13 and 20 simple moving averages for signals:


Dollar 60 min - trades Part 1:


Dollar 60 min - trades Part 2:


Of course, it won't always work out like this, but for the period covered by the two charts, using this very simple  system, there was only one small loss  - on the trade identified at point 5 which was stopped out at point 6.

I think the important point to make here is that elliott wave counts evolve as price action develops. Its important not to get stuck in one line of thought and to be open to all possibiities. Once a possible end to a count is identified, its important to be aware of what price needs to do to increase its odds of it being the correct count and what price shouldn't be doing if the count is correct. Other TA methods can then be deployed to identify entry and exit points as well as giving indications of when the count in question may be in jeopardy so that trading ideas can be adjusted accordingly.

Sunday, 18 July 2010

12:16 BST - 60 min counts page update

See the 60 min counts page in the menu above or click here

Saturday, 17 July 2010

12:09 BST - Dollar Page Updated

I've updated the dollar page

I've set out some reasons why we may see a low in the dollar soon if it didn't happen on Friday and also given some levels to watch.

Friday, 16 July 2010

21:44 BST - SPX Update

On the counts that imply the rally from the 1 July low is a corrective one (Options 1, 2, 4 and 5) I've labelled completed double/single zig zags ending with a truncation at 1099.08.

On the count that places us in a 5 wave move off the 1 July low (Option 3), which would be part of a larger correction up,  I've labelled the high at 1099.46 as wave (iii) of that advance and the subsequent decline as wave (iv).

The Options are the different ways to count the move down from 1219.80. There are 5 that I'm following and they are set out on the 60 min counts page

Today's action still leaves open the question whether the rally from 1 July has completed a corrective move or whether its only all (or maybe, part) of a larger correction up.

Here's how things stand after today:

Option 1 - Wave (ii) of [iii] topped at 1131.23

15 min chart:


Five waves down from 1131.23 on this Option represents wave i of (iii) of [iii] of minor 1. The double zig zag I have labelled from the 1010.91 low would be wave ii of (iii), so implies a wave iii of (iii) decline to follow.

The 1099.08 high is the invalidation point for the completion of wave ii on the double zig zag as labelled.

I've labelled a (1)-(2)-1-2 to account for the decline since. The invalidation points are 1079.64, which would eliminate the 1-2, and then 1098.66, which would call into quesion whether we did top at 1099.08.

Option 2 - Wave [ii] topped at 1131.23

15 min chart:


For this Option, five waves down from 1131.23 represent wave (i) of [iii] of minor 1 down. The double zig zag up from 1010.91 would be wave (ii) of [iii], so, assuming its complete, we would be in wave (iii) of [iii] down.

This is the same labelling as on the chart of Option 1 for the rally from 1 July and subsequent decline, so the invalidation points are the same.


Option 3 - Wave [iv] of an ending diagonal completed at 1131.23

15 min chart:


For this Option, 5 waves down from 1131.23 to 1010.91 could be  wave [v] of a leading diagonal down from 1219.80 and, therefore, minor wave 1.  

It places us now in minor wave 2 up.  I've labelled the start of 5 waves up from the 1010.91 low, on the assumption that we will get a zig zag type move up for wave 2, since we  would be retracing the whole decline from 1219.80, not just the drop from 1131.23.

I'm showing us having completed wave (iii) (at 1099.46) of what I'm assuming at the moment will be a 5 wave move for wave [a] of minor 2.  This would mean the current pullback should be wave (iv) of [a]. This count would be invalidated if that assumed wave (iv) were to fall below 1028.74, the wave (i) high.

Today's action may not be far off completing wave (iv) - its retraced about 38.2% of wave (iii), which is about right for a 4th wave.

The alternate labelling assumes that the 5 waves down from 1131.23 is only wave (a) of [v] and that the retracement back up was wave (b). Assuming its complete, we'd now be in wave (c) down and the count shown on the charts of the other Options would likely be in effect.

Remember, if there is further downside  to come, we must stay above 999.83 for the leading diagonal count to remain valid. 

Option 4 - Wave [b] of minor Y within intermediate (X) topped at 1131.23

15 min chart:


For this Option, 5 waves down from 1131.23 would be wave (i) of [c] of minor Y and the double zig zag up from 1010.91 would be wave (ii) of [c].

However, as mentioned previously, counting a complete 5 waves down to 1010.91 does bring in the possibility that wave [c] of Y is done so we have also completed intermediate wave (X) - see the 60 min counts page. That would put us now in a minor wave A rally and eventually take us to new highs. If wave (X) did end at 1010.91, then the impulse wave I have labelled on the chart of Option 3 would apply here.

For the moment, I've assumed we are starting wave (iii) of [c] down with a (1)-(2)-1-2 from  the 1099.08 high. The invalidation points are the same as for Options 1 and 2.


Option 5 - Minor wave X within intermediate wave (X) topped at 1131.23. Now in minor Y down

15 min chart:


On this Option, 5 waves down to 1010.91 would be wave [a] of minor Y down and the retracement would be wave [b]. If its over, we would now be headed down again in wave [c] to complete minor Y.

I've labelled a single zig zag on this chart, but its end point is the same as for Options 1, 2 and 4, namely, the high at 1099.08, so that would be the beginning of wave [c]. The same invalidation points stated for  options 1, 2 and 4  apply here.

Here's an update of the chart I posted earlier showing a possible bearish count for today's move - I've added an alternative to it as well:

SPX 1 min:


Ignore the degrees of the wave labels. I've labelled it as a (1)-(2) down, with wave (3) now in progress and subdividing. However, the alternative  (which I probably prefer) is that we may have completed a leading diagonal down from the 1098.66 high of yesterday. If that's correct, looking at the charts of Options 1, 2, 4 and 5, I would probably count it as the first wave of wave (3) (the labelling on the chart above is one degree higher than that shown on the charts of the Options).
 
If we did complete a leading diagonal at today's low, we might have to expect  a significant rally on Monday - 78.6% of the decline from 1098.66 is about 1091.

If the other count applies, we could well see a large move down as wave (3) really gets underway.

If we do rally, the leading diagonal count becomes more likely if we get above the low at (1) on the above chart, 1074.71. This is on the basis if we are in wave (3) down from the 1098.66 high, we probably shouldn't be taking out that low at this stage.  We then have to watch the 1098.66 high since if that is taken out, the chances are that we are still in a double zig zag correction, as shown on this chart that I posted earlier:
 
SPX 1 min - double zig zag still in progress:
 

The other possibility, if 1098.66 is taken out, would be that the count on the chart of Option 3 is playing out, so we would have to expect a substantial rally which could take out the high at 1131.23.
 
Have a good weekend!


20:25 BST - SPX Update

Its difficult to count straight lines and chop, but here's a very bearish count of today's action.:

SPX 1 min:


19:44 BST - SPX Update

When the NYSE up volume minus down volume looks like it does in the chart below, trading against the trend can be hazardous. Even during the periods of sideways movement today, the line has just kept dropping. And its at a level (-800,000K) that is very bearish. Its rare for the market to turn around when the up-down volume line looks like this (but then again, it is OPEX, so anything can happen - unless it all happened yesterday afternoon):

SPX - $VOLD 2 min chart:


18:15 BST - SPX Update - Go on, jump. It won't hurt...much

SPX is teetering on the edge. If it breaks below that yellow support area I showed earlier, it shouldn't be too tough to get down to the next pivot low at about 1058. After that, there's an even greater price void all the way back down to 1018-1010 since the run up from there had very little overlap in the price bars.

Here's a 60 min chart:

15:14 BST - SPX Update

Here's a close up of the support we need to break and turn into resistance highlighted on the chart of the most bearish count:

SPX 1 min - double zig zag complete:


15:10 BST - SPX Update

Although the lowest probability count I posted last night is looking OK at the moment, there's no room for complacency.

Taking out yesterday's low did negate the (1)-(2) count for wave [C] of a second zig zag (the second bearish count I posted), but it may just mean that wave [B] is still in progress. 

SPX 1 min - Double zig zag still in progress?:


I would have more confidence in the more bearish count, that the corrective rally is over, if we can get below those support areas I've highlighted and fail to recapture them on any bounce. Otherwise, the risk of further upside remains.

14:01 BST - ES Update

Here's ES with the same double zig zag count as before. Its the count that on SPX might be considered the least likley out of the three I posted in last night's update. Still, its valid until its not:

Es 5 min chart:


Getting below that wave (1) low would be a start for this count, but not conclusive.

9:02 BST - Options Equity Put/Call Ratio

Here's an updated chart of the 5 and 10 day moving averages of the CPCE (updated from my post on 25 June) which may be giving us a warning of a possible turn down in the market:

CPCE Daily Chart:


You can see that we are in the area of that blue dashed line which marked a number of important highs in the market during the 2007 to 2009 decline (see the chart from 25 June). 

Its obvious from the chart that the moving averages can drop further before a market top is formed, but with the 5 ma ticking up, its a warning that a market top may be forming near current levels. 

We need to see the 10ma tick up, however, and the 5 ma cross back above it. This has usually been a good signal of some sort of market top in the past. Its not 100% perfect, but what is.

For the moment, it should be taken as a warning to at least tighten stops on long positions.


1:38 BST - SPX Update - Support, Resistance and Void

The SPX closed yesterday right at an area of resistance that has held it back over the last few days, having earlier on, bounced off gap support (shown in close up on the 1 min chart I posted not long into the session). Here is a 60 min chart showing the point we have reached:

SPX 60 min chart - support and resistance:


The question now is will it make it through that resistance this time and get into that area of price void that exists between 1100 and 1110.


On the double zig zag count however, doing so may mark the end of the correction that the double zig zag represents, although I have shown a wave count (see Options 1 and 2 on the 60 min counts page) which raises the possibility that we could go on to push above 1110 and possibly beyond 1131.23, even on a minute [ii] or minuette (ii) correction.

On the count showing 5 waves in progress from the 1 July low (see the Option 3 chart from last night) we could easily break through and into the void, if not beyond before we see a meaningful pullback in a [b] wave. If we had a wave (iv) low yesterday as I've labelled it, wave (v) would be a 1.618 extension of wave (i) at about 1111, so we might see price fill the void then fall back quickly as it begins its wave [b] retracement. So, filling the void and reaching the next area of congestion would only be a temporary stopping point on this count.

Given the late day run up, most people are probably expecting new highs for the rally to follow. Perhaps this is where the market will catch most by surprise and just drop from here - that's what is suggested by the expanded flat wave (2) count in last night's update

As unlikely as it may seem at the moment, you never can tell with the markets. That's why, until that count is invalidated by price action, for me, it remains on the table. To have any confidence that this count is in effect, we'd need to see pretty much an instant drop and then quick progress down to and through the 1085 - 1080 area and, ultimately, 1070.

Thursday, 15 July 2010

23:43 BST - Dollar update

Although my most favoured count, that had us in wave [iv] of minor 3 has not been invalidated, the action in the dollar over the last couple of days suggests it is more likely that my next favoured count is probably correct. That has intermediate wave [1] complete as at the high on 7 June, so the decline from there is intermediate wave [2].

I said on 9 July that if we took out the low of what was assumed to be an ending diagonal at that time, then it was likely that something other than the end of the correction from 7 June was occurring. I think my previously second favourite count is that something else.

Here's the daily chart updated from the weekend:


The target for wave [2] is most likely somewhere in the 50-61.8% retracement level shown highlighted in yellow on the chart. However, we are now into an area of prior price congestion with today's decline (highlighted in blue) so its possible that wave [2] could end not too far away from current levels.

Looking at the 90 min chart, however, the wave count doesn't look complete and looking at where we possibly are in that count, we could well reach that yellow highlighted area by the time we are done:

Dollar 90 min chart:


That horizontal black line on the chart marks the low of what was thought to be an ending diagonal completing on 9 July. It did provide a good long opportunity before it was invalidated as being an end to the correction, which goes to show that you can be wrong on the wave count, yet still make money.

Once price broke the low in question, 83,622,  on the push down to 83.383, it was likely to be a good short opportunity, either within the subsequent consolidation between the black and red lines, or, on the break and re-test of the red line.

So, it looks like there should be more downside to come. However, a move now above the low marked (i) at 83.383 would mean that something is amiss with the count and that the correction may well have ended. If we break above the [b] wave high, then it will be almost certain that its ended. This all assumes, of course, that the labels are correctly placed.

21:44 BST - SPX Update

That was a wild ride! I don't have time to post all the charts of all the Options today (the Options are the different ways to count the move down from 1219.80 - there are 5 that I'm following and they are set out on the 60 min counts page) but here's how I think things look.

On the counts that imply the rally from the 1 July low is a corrective one (Options 1, 2, 4 and 5) there are a couple of ways to account for today's moves. 

The first continues to proceed on the basis that we topped yesterday (with a truncated 5th) and we have since seen a very deep expanded flat correction:

SPX 1 min - topped at 1099.08:


Obviously, it won't take much to invalidate this count! It has to drop from the outset tomorrow or it will be invalidated.

The second possibility is that we are in the alternate double zig zag I posted earlier, with today's low being the [B] wave and the rally this afternoon being part of wave [C] to complete the second zig zag:

SPX 1 min - double zig zag still in progress:


This count would be invalidated if we take out the [B] wave low  at 1080.53 without making a new high first.

On the count that places us in a 5 wave move off the 1 July low (Option 3), which would be part of a larger correction up,  I labelled yesterday's high as wave (iii) of that advance and today's low may have been wave (iv):

Option 3 chart:


The retracement for wave (iv) was 23.6% of wave (iii). I've assumed it ended at today's low and that we are now in wave (v) of [a] up. It may be that wave (iv) is still in progress - if we don't make a new high in five waves, this possibility may be on the table.

So, there seems to be a likelihood of new highs for this rally from 1 July, but I won't dismiss the possibility of a top to a corrective move up at yesterday's high until its invalidated by taking out the 1099.08 level I've labelled as the top. If that's taken out then the bear case will be put on hold for a little while longer.


20:09 BST - SPX Update

On the bearish counts, I've switched to the truncated 5th wave of [C] of the second zig zag so we only have two sets of ones and twos down rather than the three that today's action would have called for:


EDIT: Sorry - posted the wrong chart. The wave 2 should be labelled w (at 1086.92)-x (at 1083.26) -y (at 1091.91) and no ending diagonal!

16:52 BST - SPX Update

Apart from the near term bullish count shown on the chart of Option 3 which has us retracing the whole decline from 1219.80, here's another way to count the second zig zag on the Options which have us retracing only the decline from 1131.23 (see the highlighted labels):

SPX 1 min - alternate double zig zag:


It shows only wave [A] of the second zig zag as complete and we would now be in wave [B] (which may have further downside to go). So, this is another reason why we can't just assume that a major decline has started.