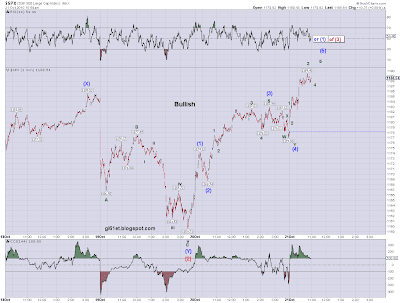
With the new high today, the immediately bearish count in Charts 1 and 2 of yesterday's end of day update has been eliminated, leaving the moderately bullish and bullish counts.
Here's the moderately bullish count, the bigger picture for which was shown in Chart 3 in yesterday's end of day update:
SPX 1 min - moderately bullish count close up:
Its possible that we've got 5 waves from the wave (iv) low to today's high, but you can see that I've allowed for another dip and rally. If we were to take out 1177.00, I'd be thinking that the 5 waves that could be wave (v) had completed, but I'd then want to see a swift decline taking out the wave (iv) low.
Here's the more bullish count updating Charts 4 and 5 from yesterday's end of day update:
SPX 1 min - very bullish count close up:
Here too, we may have topped in 5 waves up from the wave [2] low, but I've allowed for another rally.
If we have topped or nearly topped, then the alternate labelling of this rally from the wave [2] low will be more appropriate, making that rally only wave (1) of [3].
Dropping below the wave [2] low at 1159.71 would invalidate this count. While we're above that level, further upside should be expected.


