
Here' the bigger picture for the bearish count:
Chart 1: SPX 60 min - bearish count:

It shows a possible complete 5 waves up from the August low at today's high.
Here's a close up from the high at wave (iii):
Chart 2: SPX 1 min - bearish count close up:

The decline from the high started off well, but with the late rally, we're left with a (1)-(2)-1-2 count that doesn't look pretty at all.
For it to survive, we have to stay below 1181.90 in wave 2 of (3).
If we take that out, its going to look like the alternate is playing out, so there'd be more upside to come. This alternate can only be ruled out if we drop below 1159.71.
Another, possibly less bullish alternate is shown on the 60 min chart of the bullish count below - a possible diagonal for wave (v).
Here's the bigger picture for the bullish count:
Chart 3: SPX 60 min - bullish count:

This shows a sub-dividing wave (v) in a continuing 5 wave move up from the August low. This would be very bullish.
Note the alternate that I've sketched in, a possible ending diagonal for wave (v), with only the 5th wave of the diagonal to come. If the 4th wave was today's low at 1171.17, the 5th wave would have to stay below 1200.89 in order to remain shorter than the 3rd wave. So, this would certainly be a less bullish count than the main count labelled.
Here's a close up from the wave (X) of [2] high:
Chart 4: SPX 1 min - bullish count close up:
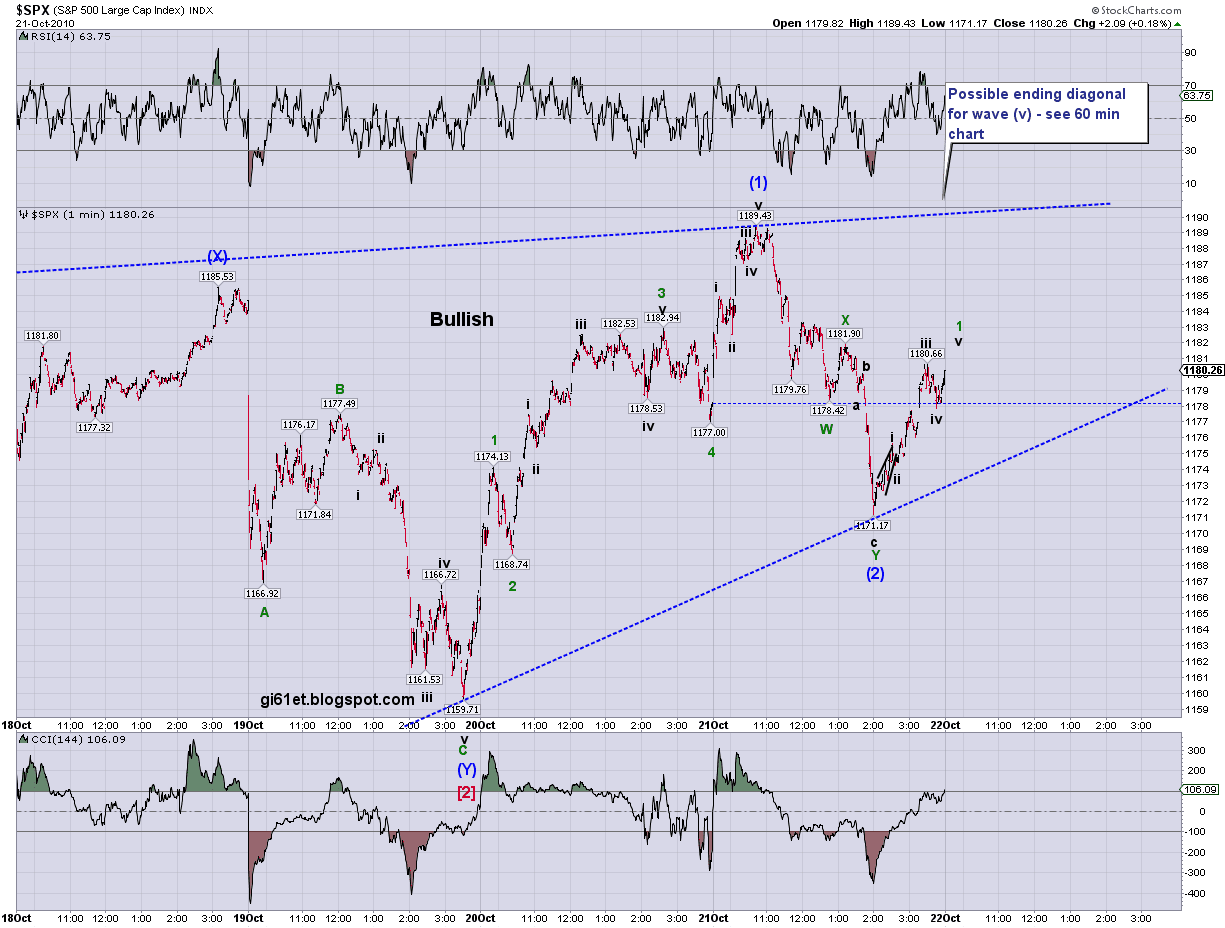
It would probably look odd if we take out 1171.17 at this stage, but it wouldn't invalidate the overall count. To do that, we need to take out the low at 1159.71.
So, its nice and simple - taking out 1181.90 calls the bear count into question and will probably cause it to revert back to a bullish count using the alternate labelling shown on Chart 2 above or the diagonal shown in Chart 3 above.
Taking out 1171.17 will raise questions concern on the bullish count but won't eliminate it. Taking out 1159.71 will rule it out.