Menu

Saturday, 30 October 2010

12:12 BST - Dollar Update

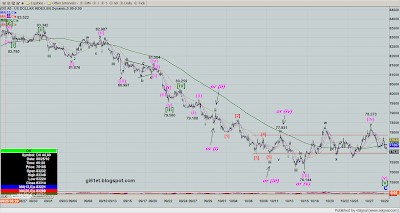
Since my last post on the dollar - see here - its moved more consistently with the more obvious count I felt might be playing out at that time, requiring a further low to complete wave C of (2) on the overall bullish count.

Here's the daily picture:

Dollar Daily:


You can see that in the last post the technicals suggested some upside to come, but with the main wave count I had, it seemed likely that this upside would be in the context of what I would label as wave (iv) of [v] of C of (2).

Looking at the updated daily chart above, we got the move up in the indicators and some upward movement in price. Price moved above the yellow highlighted area of congestion which is the area shown on the daily chart from the last post. This was bullish. However, it then moved right back down again - bearish. It then moved back above it - bullish. By yesterday, it had moved back below it - bearish. 

This oscillating action would be more obviously consistent with a correction so I think that has to continue to be my main count for this overall bullish count for the moment. This means that we should see a new low below 76.144 at some point soon.

The indicators currently seem to confirm the possibility of a further decline. As I've noted on the daily chart, the RSI failed to make it above 50, the MACD histogram has been printing lower high bars, the MACD suggests it could be about to roll over and the stochastic failed to get to overbought and is now rolling over.

Here's the 80 min chart showing how I'm labelling wave C from the wave B high at 83.522:

Dollar 80 min:


Of course, we may still be in wave (iv) which could be forming as a triangle, with the decline into Friday's close being the d wave, so there could be another move up to come before wave (v) gets going.

I think if we take out the high at 78.273 at this stage, I might start thinking that 76.144 marked the end of wave C and (2) on this overall bullish count, as shown by the alternate labelling on the 80 min chart. Certainly, if we do that without taking out the low at 76.709, it might well become a distinct possibility. Here's how I would count the move up from 76.144 as the start of wave (3) up if that low marked the end of wave (2) down:

Dollar 10 min chart:


You can see from this chart why I've said above that if we rally above 78.273 without taking out the low at 76.709, the case for a bottom at 76.144 might well be strengthened.

Even if we drop below 76.709, it may just mean that we're still in wave ii, but we'd have to stay above the 76.144 low of course, to keep this alive.

So, taking out the low at 76.709 is going to suggest that the main count, for a new low below 76.144 is on the cards. If we fail to take out the 76.709 low but instead rally up again in 5 clear waves and take out the high at 78.273 the case for a wave (2) low at 76.144 would gain strengh, but it wouldn't be conclusive - we'd have to see whatever low we rally from above 76.709 hold on the next pullback.

Friday, 29 October 2010

21:10 BST - SPX End of Day Update

Once again we're left waiting to see whether the bullish or the bearish count is playing out, that is, whether we've seen a top to the rally from the August low or whether there's still more upside to come.

The charts below show a close up of recent action. For the bigger picture please see the 60 min counts page where the bearish count is shown on the charts of Options 1 and 2 and the bullish count is shown on the chart of Option 3. This is how I'm labelling them at the moment:

Bearish count:

SPX 1 min - bearish count:


This [1]-[2]-(1)-(2)-1-2 is what I'm sticking with for now. Wave 2 has a complex look about it, but essentially, I've labelled it as a  zig zag for wave w and a triangle for wave y with  and expanded flat type correction for wave x dividing them. On this basis it would likely be complete today. 

However, it may be that wave x should be at the 1179.70 low and wave y is a second zig zag with possibly more upside to come.

If there is more upside to come in wave 2, the invalidation point for this labelling remains 1189.53 on the main labelling so that shouldn't be exceeded.

If we take out the 1189.53 high that invalidates the main count. It would still leave the possibility of a [1]-[2]-(1)-(2) intact, but that would be invalidated above 1191.44. This wouldn't be my favoured alternate count.

If we do take out 1189.53, my favoured alternate count is the one I've referred to in previous days, but which I've now shown as the alternate count on this chart for ease of reference. For this alternate count, the high of 1196.14 would be the invalidation point.

Bullish count:

SPX 1 min - bullish count:


On this count, I've continued to label it as I did yesterday,  as if we're in wave [E] of the triangle, but as mentioned then, we could still be in wave [D], in which case, I'd expect the high at 1189.53 to be taken out before we drop again in wave [E].

On this count, the high at 1196.14 shouldn't be exceeded until we complete wave [E] and wave [E] must stay above the low of wave [C] - that's at 1171.70 on this labelling.

If the 1171.70 low is taken out, I'd have to consider it likely that we'll see more downside in wave iv, possibly down to the 38.2% retracement level at about 1152.

So, with today's sideways action, nothing has really changed since yesterday.

On the counts as I've labelled them, the levels I'm watching are 1189.53 and 1196.14 on the bear count (above these levels I'd consider the risk of more upside to be high) and 1171.70 on the bullish count (below which I'd think the risk of more downside increases).

Have a great weekend!

15:32 - SPX Update on the bullish and bearish counts

Markets still poised to go either way:

Bear count:
SPX 1 min - bearish count:


Staying below 1189.53 is crucial on this labelling, but with the other bear count mentioned in previous updates, 1196.14 remains the ultimate invalidation point for the bear count.

SPX 1 min - bullish count:
If we take out 1189.53, that could be wave [D] of the triangle so its not necessarily bullish because we'd then expect a drop in wave [E].

If we drop from here without taking out 1189.53, I'd assume its wave [E] but we have to stay above 1171.70 for that to remain valid.

11:11 BST - Dax Update

The triangle I saw in the Dax last time I posted (see here) wasn't complete, contrary to what I had previously labelled. It appears that it extended further, assuming that it is a triangle, as shown on the daily chart below:

Dax Daily:


As you can see, the possibility of more upside was what  transpired following the completion of this larger triangle. Out of that triangle we now have what looks like 5 waves up. Here it is on a close up of the daily chart from the April 2010 high:

Dax Daily chart close up from April high:


I've tentatively labelled the 5 waves out of the triangle as wave C of (Y) of [2] on the bear count. Its a 0.618 extension of wave A of (Y) and also, wave (Y) is 0.618 x wave (W). 

On the bullish count, however, this 5 waves out of the triangle could just be the end of minor A of wave (Z) up.

Here's a closer look on a 15 min chart showing the recent high and the bear count labelling:

Dax 15 min:


I've labelled an expanding leading diagonal down from the high. Its supposedly a rare pattern, but that's what it looks like to me. Also, the retracement of it, which I've labelled as wave [ii]  pretty much reached exactly the 78.6% level.

However, with markets having been so bullish of late, the benefit of the doubt has to be given to the upside. The diagonal I've labelled could just as easily be a triple zig zag correction prior to another advance (on either the bearish or the bullish count) or could be wave [a] of minor B within wave (Z) on the bullish count.

If we've seen a top on the bearish count, then I want to see this next decline move down impulsively to well below the low of wave [i] down at 6553.25. I'd then want to see the retracement that follows stay below that low so it can be counted as wave [iv], and then a further impulse down to complete wave [v]. 

That sort of decline would increase confidence in the bear count. However, until we take out the low at 6115.87, any decline could just be wave B within wave (Z) up on the bullish count. That assumes that on the bullish count I have wave (X) in the right place at that low.

So, its possible that we've seen a top on the bear count.  I think at this stage that we need to stay below the high labelled wave [ii] at 6644.61 and take out the low at 6553.25.  That would be a start on the bear count. However, I think that as long as we're above 6115.87, on my labelling, the possibility of further upside can't be ignored.

Thursday, 28 October 2010

21:12 BST - SPX End of Day Update

The action today leaves open the question of whether the bullish or the bearish count is playing out, that is, whether we've seen a top to the rally from the August low or whether there's still more upside to come.

Here's how the counts look to me (the bigger picture is on the 60 min counts page where the bearish count is shown on the charts of Options 1 and 2 and the bullish count is shown on the chart of Option 3):

Bearish count:

SPX 1 min - bearish count:


This [1]-[2]-(1)-(2)-1-2 is what I'm going with for the moment. Wave 2 must stay below 1189.53. I've labelled it as complete at 1185.30 which is just over a 61.8% retracement.

However, we now need to see an impulsive move down for some sort of confirmation of this labelling.

If we take out the 1189.53 high that invalidates the count. It would still leave the [1]-[2]-(1)-(2) intact, but that would be invalidated above 1191.44. 

I'd then be left with the count for 5 waves down from 1196.14 that I showed on Chart 2 in yesterday's end of day update. For that count, the high of 1196.14 would be the invalidation point.

Bullish count:

SPX 1 min - bullish count:


On this count, I've labelled it as if we're in wave [E] of the triangle, but as mentioned earlier, we could still be in wave [D], in which case, expect the high at 1189.53 to be taken out.

On this count, the high at 1196.14 shouldn't be exceeded until we complete wave [E] and wave [E] mustn't drop below the low of wave [C] - that's at 1171.70 on this labelling. So, those are the levels to watch on this triangle count.

If the 1171.70 low is taken out, I'll be thinking its likely we'll see more downside in wave iv, possibly down to the 38.2% retracement level at about 1152.

I think at the moment we're in a quite difficult position. 

On the one hand, price action is such that it favours more upside simply because we haven't seen any truly decisive downward movement, plus of course, the trend is still up. This suggests caution is required on the short side.

On the other had, various technicals (see for example the charts I posted earlier today - click here) make a strong case for at least a pullback, suggesting caution on the long side.

The only thing to do is to indentify important levels on whatever count you're following and use them to let the market tell you which way it might be going.

On the counts as I've labelled them, the levels I'm watching now are 1189.53, 1191.44 and 1196.14 on the bear count (above any of these levels I'd consider the risk of more upside to be high) and 1171.70 on the bullish count (below which I'd think the risk of more downside increases).

18:31 BST - SPX Update on the bullish count

Here's an update in the bullish count - note that we may still be in wave [D] rather than in the middle of wave [E] of the triangle. If so, we're likely to take out the 1189.53 high in wave (Y) of [D]:

SPX 1 min - bullish count:

17:55 BST - SPX Update on the bearish count

Here's an update for the bearish count posted earlier (I've upped the degrees by one):

SPX 1 min - bearish count:


For the main count, wave 2 must stay below 1189.53. If we take that out then I'll be left with the count for 5 waves down from 1196.14 shown on Chart 2 of yesterday's end of day update.

If the alternative count is playing out, we have to stay below the wave 2 high at 1183.53 in wave ii.

15:26 BST - SPX Update on the bullish count

Here's what I'm looking at on the bullish count:

SPX 1 min - bullish count:


If the wave (1) high at 1179.52 gets taken out on this current decline, then we'll have 3 waves up from the low labelled iv, which makes the triangle option look more likely for a continuing wave iv. We'd have to stay above 1171.70 to keep that option intact, assuming that's wave [C] of the triangle with today's high being wave [D].

If we take out that low and then also take out 1171.17, I'll be thinking wave iv is forming an expanded flat with a subdividing [C] wave as mentioned in yesterday's end of day update.

14:46 BST - SPX Update on the bearish count

On the bear count, the count  shown on Chart 1 in yesterday's end of day update has been invalidated with the move above 1187.11. That leaves the count for 5 waves down from 1196.14 which I showed on Chart 2 in yesterday's end of day update, which means the bear count stands until we take out 1196.14. Or, there's this count which is invalidated above 1191.44:

SPX 1 min - bear count: expanded flat for wave 2 of (3) down:


So, 1191.44 and 1196.14 are the levels to watch to keep the bear count alive.

11:45 BST - SPX: Indicators and Internals still suggesting conditions are in place for a pullback - confirmatory price action still awaited

These charts, updated from the last time I posted them on 22 October (click here to view that post) continue to suggest that care is required on the long side:

SPX Daily:


The comments made in that last post with regard to the indicators on this chart continue to apply as price remains stuck around the median line of the pink pitchfork.

CBOE Equity Options Put/Call Ratio:


The 5ma has moved decisively above the 10ma and the latter is trying to break above the pink downward (bullish for the market) channel.

The McClellan Oscillator failed to make a new high with the market once again, simply backtesting the broken green upward channel and the zero line. It still paints a bearish picture.

SPX Percent of Stocks Above the 50ma:


The sell signal triggered on 19 October remains in force, but we now have the 13ma now appearing to roll over, which should reinforce the signal.

NYSE Tick:


The bearish divergence on this chart continued as the market shot up to the 1196.14 high, so, still indicates internal weakness.

In light of all of the above, short trades do seem to have a good risk reward, provided (and this is crucial, of course) proper stops are placed. This is because despite everything shown in the above charts, we still haven't seen any decisive downward action to confirm what these charts are suggesting. Until we see that, the trend remains up and these divergences and bearish configurations can feasibly continue and/or work themselves off as the market goes sideways or grinds higher.

Wednesday, 27 October 2010

21:15 BST - SPX End of Day Update

Following today's action, I'm left with two counts, one bullish and one bearish. The bearish one assumes that the rally from the august low topped at 1196.14 while the bullish count anticipates more upside before we see a top. You can see where these shorter term charts fit into the bigger picture on the 60 min counts page.

Here's the bearish count:

Chart 1: SPX 1 min - bearish count:


This shows a (1)-(2)-1-2-i-ii down from the 1196.14 high. For this count, as labelled, to remain valid, we need to stay below the high at 1187.11 on this current rally which I have as wave ii of 3 of (3). Its retraced nearly 78.6% of wave i now, so really needs to start dropping.

While that high remains intact, I'm thinking the odds are for more downside.

Its possible that we have 5 waves down from the 1196.14 high as you can see from the labelling on Chart 2 below, in which case, only taking out the 1196.14 high will invalidate the bearish count. However, I think that a move above 1187.11 will make me very cautious about the bearish count.

Here's the bullish count:

Chart 2: SPX 1 min - bullish count:


As mentioned in my last update, wave iv may be complete at today's low as labelled, or wave [C] may be subdividing as shown on Chart 1 above, to achieve a deeper retracement than we've seen so far (23.6%). The 38.2% retracement level is at about 1152, so that needs to be borne in mind.

Again, I think that the 1187.11 level is the level to watch here. If it remains intact, the chances are we'll see more downside. Taking out that level doesn't necessairly mean that wave iv is over, however, since the triangle possibility (see the blue dotted lines) remains and we'd now be in wave [D] of such a triangle. However, 1171.70 would mark the lower limit for wave [E] if a triangle is playing out here.

So, its nice and simple today - I'm watching 1187.11. Above that level, I'll be seriously questioning the bearish count even though it won't be invalidated unless we take out 1196.14. While we remain below 1187.11, I'll favour more downside.


19:19 BST - SPX Update on the bullish and bearish counts

Here's what I'm looking at on the bullish and bearish counts at the moment:

SPX 1 min - bearish count:
We have to stay below 1187.11 for this count to remain valid. 

SPX 1 min - bullish count:
Its possible that wave iv has bottomed - I've relabelled it to an [A]-[B]-[C]. However, we could be in a subdividing wave [C] down if I apply the count shown on the bearish chart  for the decline from 1196.14, so again, I'm watching the 1187.11 level. If we don't take that out, we should see more downside either on this bullish count or on the bearish count.


16:16 BST - SPX Update on the bullish and bearish counts

The ending diagonal shown in Chart 2 of yesterday's end of day update has now been invalidated with price reaching the dotted blue line shown in that chart.

That leaves the completed ending diagonal shown in Chart 1 of that update and the new bullish count I posted earlier today (see here). Here are the close up charts updated with the action so far today.

SPX 1 min - bearish count:


On this count, today's decline would be wave i of 3 of (3) down. Its not clear whether its complete yet. If things are really bearish and we just keep falling, it may start to look like the decline is wave (3) itself. However, one step at a time - I'll just see how things go.

SPX 1 min - bullish count:


The possibility of a triangle for wave iv will be invalidated below 1171.17. In that event, I'd be looking at wave iv as an expanded flat type of correction. I'm not sure its complete yet. the 38.2% retracement of wave iii is at about 1152, so there could be more downside to come in this wave iv. However, we're now at the 23.6% retracement, so its an area to watch for a potential reversal.


11:47 BST - SPX Update - revised bullish count

I've been saying for the last few days that I don't really like the bullish count that I've been showing where the 5th wave of the rally from the August low is subdividing. So, I've come up with a new bullish count which I prefer and which I'll be following instead.

Here it is on a 60 min chart which zooms in on the rally from the August low:

SPX 60 min - new bullish count:


As you can see, it puts us in an extending wave (iii), which incorporates an extended wave iii and which is forming in a nice channel. 

At the moment, the count places us possible at the start of wave v of (iii), though as noted on the chart, wave iv may still be in progress if its forming a triangle instead of what looks like a completed running correction.

The triangle possibility for wave iv would be off the table if we take out the low at 1171.17 which I would consider to be the [A] wave if a triangle is in progress.

There is a slightly less bullish way to count this, which would make the high at 1189.43 wave (iii) and the low at 1177.72 wave (iv), so leaving only wave (v) up to come. I've labelled it on the close up chart:

SPX 1 min - new bullish count close up from the 1184.38 high:


With this count, the obvious invalidation points are well below where we are currently: if we're in wave iv of (iii) then it can't drop below 1105.10 (the wave i of (iii) high) and if we're in wave (iv) of [i] then it can't drop below 1065.21 (the wave (i) of [i] high). Therefore, for earlier clues, I'd be relying on wave behaviour to suggest that this count may not be playing out. By that I mean, of course, a significant 5 wave decline that has undoubtedly impulsive characteristics - something that we simply haven't seen since this rally started at the end of August, so hopefully, it should be easy to recognise when it does happen.

Until we see that, then I'd assume that further upside remains.

Tuesday, 26 October 2010

21:07 BST - SPX End of day Update

All three counts I'm following, bearish, moderately bullish and bullish, remain on the table. You can see them in context on the 60 min counts page, where the bearish count is on Chart 1, the moderately bullish count is on Chart 2 and the bulish count is on Chart 3.

Bearish:

Chart 1: SPX 1 min - bearish count:


This assumes that a top to the rally from the August low was put in at 1196.14, with a 5th wave ending diagonal.

From that high, I'm labelling a (1)-(2)-1-2 down. Its crucial that we stay below the high at 1191.44. If we take that out now, this count is going to be invalidated and it will be highly unlikely that we topped at 1196.14.

Moderately bullish:

Chart 2: SPX 1 min - moderately bullish count:


On this count, the high at 1196.14 is assumed to be the 3rd wave of an ending diagonal to complete the rally from the August low.

If the 4th wave of this diagonal is at 1177.72 as labelled, then the limit for the 5th wave is 1214.15, in order for it to remain shorter than the 3rd wave. However, all it needs to do is take out the high at 1196.14 in a zig zag pattern to complete the 5th wave.

Taking out the low at 1177.72 now, before we make a new high, might start to raise questions about this count. However, it would be possible that we're still in wave [4] if that happens, as a double zig zag (with today's move being the end of the (W) wave and the (X) wave), but it would have to stay above the dotted blue line for this diagonal to remain a valid count. If it fails to do so, then that might raise the odds that the bearish count is playing out.

Bullish count:

Chart 3: SPX 1 min - bullish count:


On this count, I've labelled a subdividing 5th wave for the rally from the August low. Provided we stay above 1159.71, this count remains on the table, though I still can't say I like it given that its likely to result in a 5th wave that's out of proportion to the 1st wave in the rally from the August low. However, that doesn't invalidate it, so its something I'm keeping an eye on.

So, the levels I'm watching on these counts are: 1191.44 (to keep the bearish count on the table, even though, strictly, its not invalidated unless we take out 1196.14), the blue dotted line which is at about 1172-1175 (which price has to stay above if the moderatley bullish count is playing out) and 1159.71 (which, if taken out, will invalidate the bullish count as I've labelled it).

17:29 BST - SPX Update

The bearish count showing a top at 1196.14 now needs to stay below 1191.44 in order to remain valid:

SPX 1 min - ending diagonal complete:


The continuing ending diagional may have started its 5th wave up:

SPX 1 min - continuing ending diagonal:


If we take out 1177.72, I'll start to question this count, but it won't be invalidated unless we drop to the blue dotted line before making a new high above 1196.14.

On the bullish count, we may also have started the next leg up:

SPX 1 min bullish count:


If we drop below 1177.72, this might start to look questionable, but won't be invalidated unless we take out 1159.71.

15:18 BST - SPX Update on the ending diagonal counts for the 5th wave up from the August low

Its possible that the completed ending diagonal count shown on Chart 1 of yesterday's end of day update is playing out. However, I'll be questioning it if we take out the low at 1186.36 before we take out today's low to make 5 waves down from 1196.14:

SPX 1 min - completed ending diagonal:

If we do that, and even more so if we take out 1191.44 while we only have 3 waves down from yesterday's high, I'll be looking to the unfinished ending diagonal that was shown on Chart 2 of yesterday's end of day update:

SPX 1 min - continuing ending diagonal:

Monday, 25 October 2010

21:15 BST - SPX End of Day Update

So, the bearish count last shown in Chart 1 of Friday's end of day update was eliminated today, leaving the ending diagonal and bullish counts on the table.

The ending diagonal may be complete at today's high, with today's push up being the (C) wave of the final leg of the diagonal anticipated in Chart 2 in Friday's end of day update.

Here's the count for the completed ending diagonal (the bigger picture is shown on Chart 2 on the 60 min counts page):

Bearish count:

Chart 1: SPX 1 min - bearish count, complete ending diagonal:


You can see that I've labelled 5 waves down from today's high, with the sideways action seen after that initial decline as a 2nd wave. Obviously, today's high at 1196.14 cannot be taken out if this count is playing out. I'd probably start getting concerned about this count if we now take out the high I've labelled as wave (2) at 1191.44.

Taking out the low at 1171.17 must be the first objective if this count is correct, but I'd then want to see a quick move below 1159.71 follow.

If we take out the high at 1196.14, then this count will be invalidated. However, as I've shown previously, its possible we'd still be in an ending diagonal, with today's high having been only the 3rd wave, not the 5th wave. Here's how that would look:

Moderately bullish, continuing ending diagonal count:

Chart 2: SPX 1 min - continuing ending diagonal:


As you can see, I'd put us still in wave iv of the ending diagonal. It may be that the late low at 1185.13 may mark the end of wave iv. If we take out the wave [B] high at this stage, that's probably what I'll be thinking.

Wherever wave iv ends, with wave iii being 36.43 points, for the diagonal to remain a valid count, wave v would have to be shorter than that, so once we can say that wave iv has ended, we can calculate a maximum target for wave v, assuming that this diagonal is playing out.

If there's still more downside to come in wave iv, it  will have to stay above the dotted blue line for the diagonal to remain valid.

Bullish Count:

Chart 3: SPX 1min - bullish count:


This has us in a subdividing wave (v) in the rally from the August low.

On this count, I've labelled today's high as wave 3 of (3) within wave (v) (see Chart 3 on the 60 min counts page for the larger picture).

If we take out the high at 1183.93 before we make a new rally high, I'd really start to question this count. However, it may be that we're still in wave (2) as an expanded or running flat if that happens. That possibility would only be invalidated if we took out the low at 1159.71.

So, for the moment, the levels I'm watching are 1196.14 (to keep the bearish count on the table, but I'd be concerned about the bearish count if we take out 1191.44 at this stage), the blue dotted line on  Chart 2 above (taking that out before a new rally high would invalidate the continuing ending diagonal count on that chart) and 1159.71 (taking this out will rule out the bullish count as I've labelled it).

15:45 BST - SPX Update on the ending diagonal and the bullish counts

The bearish count from Chart 1 in Friday's end of day update was invalidated today, which leaves the ending diagonal as the bearish count now (Chart 2 from that update) and the bullish count (Chart 3 from that update).

Here's the ending diagonal:

SPX 1 min ending diagonal:


It could be counted as complete at today's high, but taking out the high at 1183.93 which I've labelled (A) of [5] would help this count, but then I'd like to see 1171.17 and then 1159.71 and/or the blue dotted line get taken out. Taking out the blue dotted linewould rule out the alternative shown that today's high is only wave [3] of the diagonal.

Here's the bullish count:

SPX 1 min - bullish count:

If the labelling is correct and we're in wave 4 of (3), we have to stay above the wave 1 of (3) high at 1183.93. Taking out that high before we take out today's high would make me start to doubt this count.

Friday, 22 October 2010

21:13 BST - SPX End of day Update

You can see the bigger picture for each of the following counts on the charts of Options 1, 2 and 3, respectively on the 60 min counts page.

Bearish count:

Chart 1: SPX 1 min - bearish count:


This assumes a top to the rally from the August low at the high of 1189.43.

With the sidways action today, its unclear whether wave (2) has ended, as labelled, or whether its still in progress, with another up leg to come. 

Taking out 1183.93 will invalidate the little i-ii that I've labelled. Given the sideways action today, I think its probably more likely that we'll see more upside in wave (2), but until that high at 1183.93 is taken out, I'll leave the labelling as it is.

If there is more upside, it has to stay below 1189.43 for the count to remain valid.

If that high is taken out, I'll be looking to the following count as likely playing out.

Moderately bullish ending diagonal count:

Chart 2: SPX 1 min - ending diagonal:


This count puts us in an ending diagonal wave v in the rally from the August low.

As mentioned in the update posted last night, if we're in wave [5] of this diagonal, it has to stay below 1200.89 to remain valid and it has to take out the high labelled wave [3] at 1189.43.

If we exceed 1200.89, it could either mean that we're only in wave [3] of the diagonal or that the more bullish count below is playing out.

If we're still in wave [3] of the diagonal to a new high for the rally from the August low, then once its complete, wave [4] will have to stay above the dotted blue line for the diagonal to remain valid.

If we take out the low at 1171.17 before making a new high at this stage, I'd start to question the diagonal. However, it won't be ruled out until we take out 1159.71 or the dotted blue line.

Bullish Count:

Chart 3: SPX 1min - bullish count:


This has us in a subdividing wave (v) in the rally from the August low.

Its not clear whether wave 2 of (3) is complete today or if it has more downside to go before we see more upside. More downside would make sense given that wave 2 is, so far, a very shallow retracement. If there is more downside to come, it needs to stay above 1171.17 for the labelled count to remain valid. 

If we take out that low without new highs, we may still be in wave (2), so the overall count will remain valid. However, we'd then have to stay above 1159.71 in wave (2) to keep that count alive.

At the moment, I'm tending to prefer the bearish count given the technical picture outlined in my earlier post. However, if we take out the high at 1189.43 and invalidate that count, then my preferred count will be the ending diagonal, again, given the current technical picture and also because its probably more likely to result in a wave v that is more in proportion to wave i in the rally from the August low than the bullish count shown in Chart 3.

So, for the moment, the levels I'm watching are 1189.43 (to keep the bearish count on the table), 1171.17 (taking this out might be a warning that the ending diagonal or the bullish counts may not be playing out, but won't invalidate them) and 1159.71 (taking this out will rule out the ending diagonal labelled and the bullish count). I'm also watching the dotted blue line on Chart 2 above, since a drop below that will rule out the diagonal count shown.

Have a great weekend!

19:29 BST - SPX Update on the bearish, moderately bullish and bullish counts

Quick update on the counts:

Bearish:

SPX 1 min - bearish count:


Its not clear if wave (2) is complete. There's room for it to go higher. 1185 is about the 78.6% retracement level.

The sideways action today suggests a corrective move, but whether it precedes another leg higher to complete wave (2) or the next leg lower remains to be seen.

Moderately bullish ending diagonal:

SPX 1 min - ending diagonal:


Here, wave (B) of [5] of the diagonal may have more to go to the downside, but can be counted as complete now.

Bullish:

SPX 1 min - bullish count:

As with the ending diagonal count, wave 2 may be complete now or may have more downside to go. If there's more downside, it has to stay above 1171.17 on this count.