The Options referred to below are different ways to count the move down from 1219.80 to 1010.91 and you can see them on the 60 min counts page, which will put the charts below into context.
The 10 min charts below show various ways to count the rally from the 1010.91 low on 1 July in the context of the larger picture shown on those 60 min charts.
On the charts of Options 1 and 2, I'm showing a single zig zag. On the chart of Option 3, there is a triple zig zag, on the chart of Option 4 there's a double zig zag and on the chart of Option 5, there is a single zig zag with an ending diagonal for wave (c).
Here are the 10 min charts:
Options 1 and 2 - from 1010.91, a double zig zag:

I'm still only showing the 10 min chart of Option 2 since the counts are now the same under both these Options, namely, a single zig zag which is complete at 1129.24. Here's a more zoomed in look on the 1 min chart I've been posting:
SPX 1 min:

I've amended the labelling slightly from earlier, but overall, the bearish count I showed at the end of yesterday seems to be playing out, so far.
We've taken out three of the levels I mentioned in last night's update, so excluded the near term bullish counts that remained while those levels were intact.
We've taken out three of the levels I mentioned in last night's update, so excluded the near term bullish counts that remained while those levels were intact.
However, for the moment, the main level I was watching, 1088.01, remains - but only just. Taking out 1088.01 would provide a higher degree of confidence in a top since that's the last low that has to survive if wave c is going to extend. on this labelling.
If the labels on the 1 min chart above are correct however, we should take out 1088.01 very soon.
However, taking it out doesn't mean we can assume that its all down from here. There are still bullish counts on the table - see under Option 4 below. So we just need to keep monitoring important levels as the price action develops to try and get an early warning that a bullish count is more likely to be playing out and that this count is wrong.
On the labelling in the 1 min chart above, if we have completed or nearly completed wave [3] down, the next retracement would be wave [4]. Wave [4] cannot end above the wave [1] low at 1111.58, so, if we retrace up to that level in an assumed wave [4], that may well be an early warning that something is amiss with the bearish count.
It won't be conclusive, because we could be in the [1]-[2]-(1) count I had on the 1 min chart earlier, with wave (1) of [3] being the wave that is complete or nearly complete. In that case, we could retrace all the way back up to 1127.16 and the bearish count could stand -it wouldn't be very pretty and I think if we were to get such a retracement, we'd have to be very cautious of the risk that the action was telling us that the bearish count is not in play.
Nevertheless, from an elliott wave stand point, 1111.58 and 1127.16 are the levels to watch to the upside.
To the downside, the level we need to take out to dismiss the bullish count shown below is 1010.91.
Option 3 - from 1010.91, a triple zig zag:

This too, can count as complete at 1129.24 and that's how I've labelled it for the time being. Of course, 1129.24 must remain intact if that is the case.
The count from the high at 1129.24 is the same as shown under Options 1 and 2 above, so please refer to the 1 min chart posted above and the comments there about the levels to watch.
The count from the high at 1129.24 is the same as shown under Options 1 and 2 above, so please refer to the 1 min chart posted above and the comments there about the levels to watch.
Option 4 - from 1010.91, a double zig zag:

This double zig zag can also count as complete at the 1129.24 high. The count from there is the same as the count from that level under Options 1 and 2, so the comments made there apply here also.
This is the bullish alternative count mentioned above (see the alternative count on the second chart under the Zig zag from march 2009 page for the bigger picture).
Here it is on a 1 min chart:
SPX 1 min - Option 4, bullish alternative count:

Technically this remains valid as labelled since we haven't taken out the 1088.01 low. However, it may be more likely that wave (ii) is forming an expanded flat as mentioned in my earlier post today, or that we have seen a leading diagonal up from the July low as shown in this chart which I've updated from that earlier post:
SPX 60 min - bullish alternative leading diagonal wave A:

You can see that I've labelled the 1129.24 high as wave A, but it could be wave [i] of A. Whatever it is, the retracement could be almost done as a zig zag. However, a normal retracement of a diagonal is considered to be 78.6% - that would take us down to about 1036. Having said that, in elliott wave terms, once we can count 5 waves down from the high that I've labelled (b) of B, we should be on alert for a rally back up in C or [iii] of A, regardless of whether or not we have reached the 78.6% retracement.
Obviously, any retracement must stay above 1010.91 for this count to remain valid.
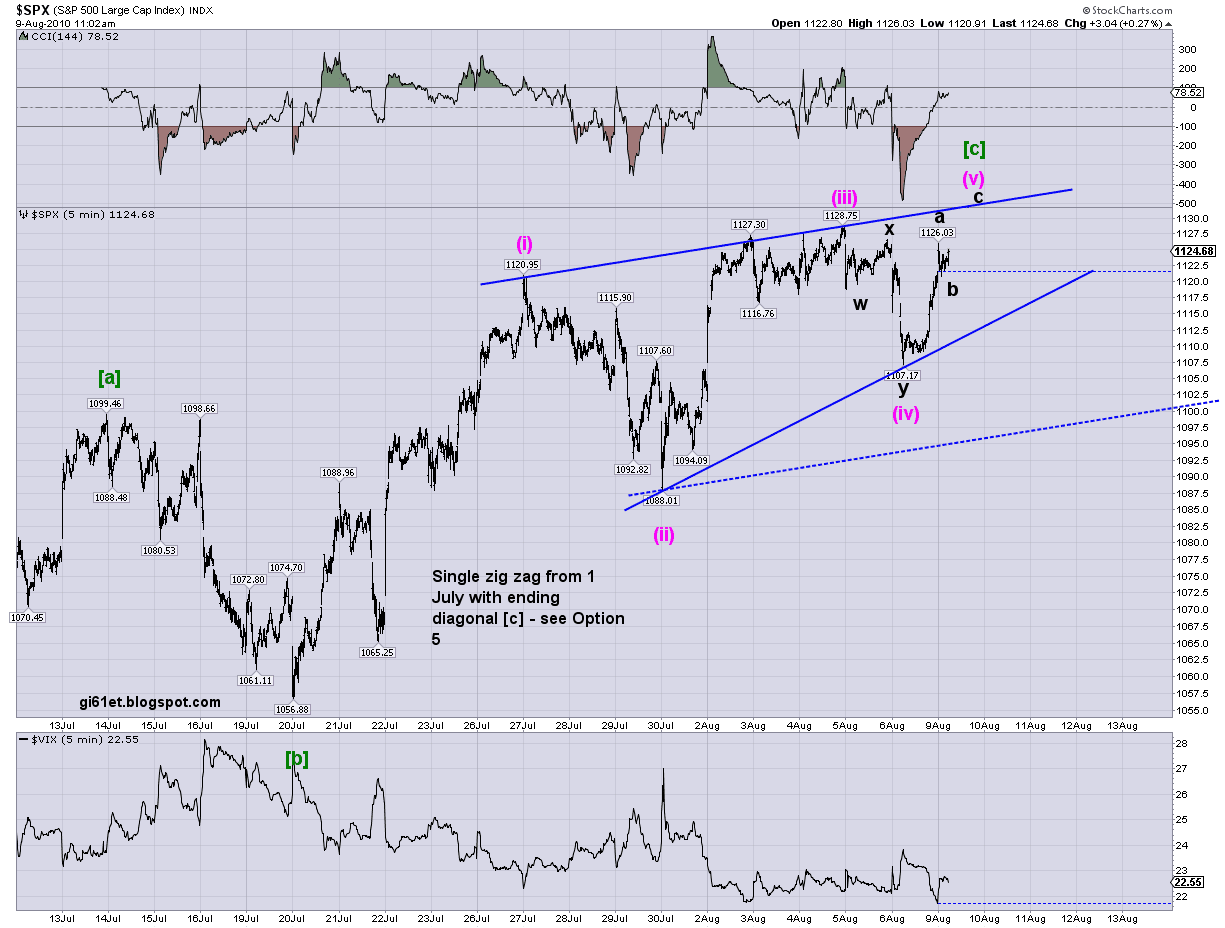
Option 5 - from 1010.91, a single zig zag with an ending diagonal for wave (c):

A complete ending diagonal can be counted into the high at 1129.24. I've labelled it as such. Taking out 1107.17 today has precluded the possibility of a continuing wave v.
So, the count down from 1129.24 is the same as for Options 1 and 2 so please refer to the 1 min chart and the commentary there as they apply here also.