On the 3 Options set out on the 60 min counts page, I'm looking for the end of 5 waves up from the August low to mark the end of minor 2 (or (i) of [c] of 2) on Option 1, the end of wave X on Option 2 or the end of wave [i] of C (or (i) of [iii] of A) on Option 3.
Please refer to the 60 counts page for context.
It may be that we have a good candidate for a top at today's new high for the rally from the August low at 1157.16. This is based on the ending diagonal I've been showing.
Here it is on the bigger picture for the move up from the August low (labelled as if Option 1 is playing out):
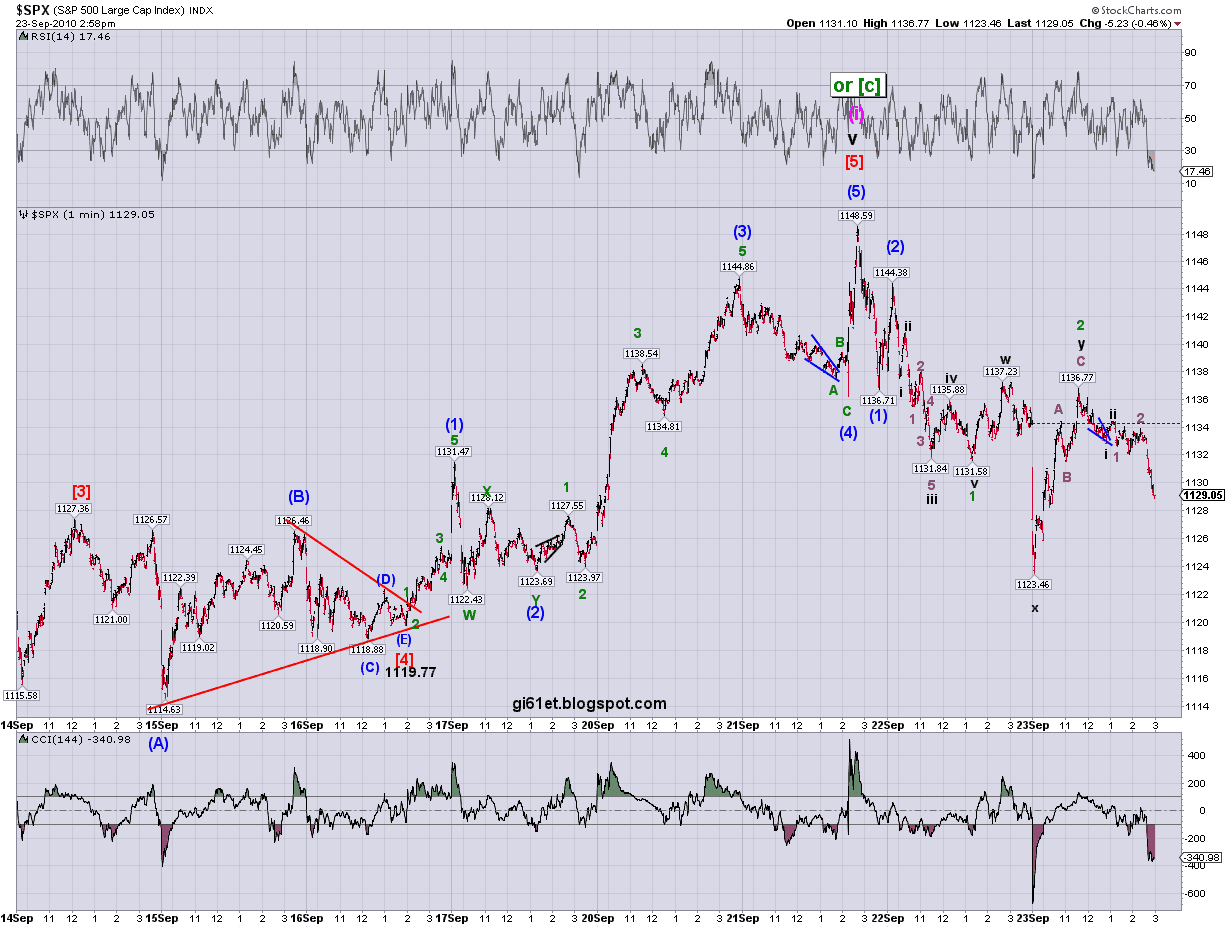
Chart 1: SPX 1 min - 5 waves up from the August low:

Here's a closer look:
Chart 2: SPX 1 min - 5 waves up from the August low close up:

Here's a closer look:
Chart 2: SPX 1 min - 5 waves up from the August low close up:

We had what may reasonably be counted as a 5 wave decline from the high at 1157.16 and the move up from there appears to be 3 waves.
If this is correct, I want to now see an impulsive move down that takes out the low at 1132.09 and the low at 1122.79. As explained in my earlier post, taking out the first level will preclude a further high to come in wave v of the diagonal that I've labelled on the above charts. Taking out the second level will start to make the bullish case look doubtful (though it won't be invalidated).
Its possible that wave [2] still has further upside - so far we've retraced about 50% of the decline from the high. The move down from where I've labelled wave [2] doesn't look impulsive at the moment, so we could still be in the (B) wave. If so, it may well try to get to the 61.8% level at about 1149 before its done. A 5 wave decline below 1136.08 will mean that wave[2] should be over.
To the upside, we obviously need to stay below the high at 1157.16.
Turning to the more bullish counts, here's the bigger picture (the labelling on these charts relate to Option 3):
Chart 3: SPX 1 min - 5 waves up from August still in progress:

This is beginning to look unlikely as far as starting wave (v) up is concerned. However it can't really be ruled out. If we take out 1132.09, that will eliminate the i-ii-[1]-[2] and the possibility that wave (iv) ended at 1132.09, but still leaves the possibility that we're in a i-ii from the 1122.79 low. If we take out 1122.79, that will eliminate the i-ii count for the start of wave (v) up, but won't rule out the possibility that we're still in wave (iv). I have the high of wave (i) on this count at 1065.21, and that's what will rule out a continuing wave (iv) as far as elliott wave is concerned.
Here's a close up:
Chart 4: SPX 1 min - 5 waves up still in progress, close up:

You can see even more clearly at this scale why I think this count, showing the start of wave (v) up at 1122.79, seems unlikely, with all the ones and twos in there.
You can also see that if we take out 1136.08, the blue (1)-(2) will be eliminated. Then, as mentioned above, the next levels to watch are 1132.09 and 1122.79.
The possible diagonal I've sketched in suggests a top has been put in at 1157.16 even on this count. Still, I want to see the levels mentioned above taken out to gain greater confidence in this.
So, the levels I'm watching for some sort of confirmation of an end to the rally from the August low at 1157.16 are 1136.08, 1132.09, 1122.79. To the upside,we have to stay below the current high at 1157.16.