Menu

Thursday 19 August 2010

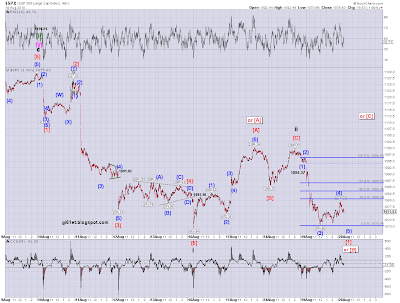
21:23 BST - SPX End of Day Update

From my previous posts you'll see that on the bearish counts, I'm looking at a 5 wave decline from the high at 1129.24, representing a 1st wave down, followed by a 3 wave pullback for a 2nd wave retracement, whether the 1st wave ended at 1176.69 or at 1069.49. You can see the earlier post here.

To put these counts in context, please see the 60 min counts page which explains the counts I'm following and what the labelling in the shorter term charts I look at day to day means in the context of each of those counts.

So, for those bearish counts, here's how we ended up today:

SPX 1 min from the high at 1129.24:


This chart uses the labels and degrees relating to Option 2, but relates to the bearish counts for all the Options referred to on the 60 min counts page.

So, from the 1129.24 high, I'm counting a i down and ii up. The alternate labels on the chart relate to the chart I posted earlier which allows for one more push up to complete wave ii - see the post here.

Obviously, we can't know whether or not that further push up is going to happen. We can only watch the rallies we get and monitor them for clues as to whether or not they will turn into something impulsive looking enough to be a [C] wave. For the immediately bearish case, we're looking for a 3 wave rally that ends somewhere in the region of a 50% retracement once we've completed 5 waves down from the wave ii high.

For the moment, I have us still needing a wave (5) to complete wave [1] down. Here's the count close up (I've changed the degrees from the charts posted earlier today to match the degrees in the first chart above):

SPX 1 min close up:


If that's the correct labelling, we need to stay below the wave (1) low on this wave (4) retracement. That low is 1094.37. However, it really wouldn't look like a 4th wave if it got that high. I think if we retrace much more than above the 50% level at about 1083, I'd start thinking that we had already seen 5 waves down to complete wave [1] at the low of 1070.66 (I mentioned this as a possibility in earlier posts today) and that we were now in a wave [2] retracement. If its wave (4) then the retracement we've seen this afternoon to about the 38.2% level would be a perfect place for this wave (4) to end.

If its a wave [2] retracement, ideally it won't get too much above a 50% retracement (that would be at about 1085), but as we know 2nd waves can retrace more. Ultimately, the level to watch would be the high of wave ii at 1099.77 since taking that out would invalidate this labelling. 

However, the alternate labelling would still be in play, which would make the rally from the low at 1070.66 wave [C] of ii. We would then look for an impulsive decline to take out the 1077.66 low to gain some confidence that the alternate bearish count on the above chart was playing out and not something more bullish.

Speaking of the bullish counts, the first one shown in last night's update (see here) has been pretty much invalidated. However, because we haven't taken out the low at 1069.49, technically, the labelling on the chart of the second bullish alternate shown in that update is still valid. I've left that labelling on the chart of the second bullish alternate below, but shown a revised labelling on the chart of the first bullish alternate:

SPX 1 min - first bullish alternate under option 4 - impulse up from 1010.91:


As shown on the chart, this count remains in play as long as we stay above 1056.88 on this alternate. That's the low of wave [ii] of the impulse up from 1010.91. You can see it on the 1 min chart of this alternate under Option 4 on the 60 min counts page

SPX 60 min - second bullish alternate under Option 4 - leading diagonal up from 1010.91:


Given the depth of the retracement in wave [ii] of C, this count seems unlikely, but if that 1069.49 low holds, its valid. If we take out that low, we could still be in wave B and that will apply until we take out the low of 1010.91.

So, for the bearish count, if we had a wave (4) retracement this afternoon, we want to see a move to new lows below 1070.66 and, of course, 1069.49. If we're in a wave [2] retracement up from 1070.66, ideally, we won't get much above 1085. If we take out the 1099.77 high, focus would switch to the alternate count shown  for the bear case and we would look  for a 5 wave rally from 1070.66 to be followed by impulsive declines that take out the 1070.66 low soon after that.

If we take out 1056.88 to the downside, the first bullish alternate will be invalidated. However, the second bullish alternate will remain in play until we take out 1010.91.
18:47 BST - SPX Update: 15 and 60 min charts

Here's an update of the 15 min chart I posted earlier (see here):

SPX 15 min pitchforks:


Price has moved straight down to the lower line of the pink fork and the median line of the red fork, without much hesitation. It looks like the action we saw within the blue fork after the 1127.16 high.

You can see that price has bounced a bit from the lower line of the pink fork. The bounce may find resistance at the median line of that old blue fork which still seems to be in play. 

Ideally, for the bearish case, I'd like to see any bounce stopped at the area of the median line of the pink fork. 

You'll see that I've drawn in a new upward green fork - this will have to be watched. Price may at some point, try to get to its median line, this could certainly happen if we have completed the 1st wave down and get a 2nd wave retracement.  If its only a 2nd wave retracement and not something more bullish, this attempt ought to fail - remember that's what I pointed out happened in relation to the upward black fork in the earlier post (see here) and its also what we seem to have seen with an upward fork on the 60 min chart (see below).

What would be very worrying for the bear case is if we start breaking above the median line of the upward green fork. That would be bullish action unless it resulted in an immediate drop back down.

Finally, here's the 60 min chart updated from last night (see here):

SPX 60 min pitchforks:


The reason I'm posting this is to show the upward grey  fork that I've drawn on from the 1 July low which has been broken by today's move. You'll also see that price failed to get up to the median line of that fork, which was bearish. Its possible that we'll see price rally back up to test the grey fork from below. If the bearish counts are playing out, the rally should be rejected by the lower line of the grey fork. 

18:17 BST - SPX Update: More upside in this 2nd wave?

Here are three charts on which I've marked three different ways to count the decline from 1129.24 and/or the move from the low at 1069.49:

SPX 1 min - expanded flat 2nd wave correction:


On this count I think it unlikely that we will see more upside in the 2nd wave. If its correctly labelled with wave (C) at the 1099.77 high, its possible that could have ended a wave (W) in a double three correction from the wave [1] low, but that would mean we'd have waves (X) and (Y) still to come. Supposedly, double threes occur to extend the time taken by a correction, but when you look at the time taken for wave [1], it doesn't seem to be necessary for wave [2] to take any more time than it has on this labelling.

So, if this labelling is correct, I'd consider further upside in wave [2] unlikely.

SPX 1 min - zig zag 2nd wave:


On this count too, its possible that we've only seen wave [W] within wave ii, but again, the time issue mentioned above would suggest its unlikely.

SPX 1 min - (A) and (B) of a flat for [2] complete, wave (C) to come:


On this labelleing I think its very possible that the market has one more move up to complete the 2nd wave correction. This labelling assumes it would be a quick move up in wave (C), so would not take up too much more time. It could even start today.

So, while things looks very good for the bears at the moment, I think that one more launch up on the third count shown above can't be ruled out. 

If we've completed the (B) wave on this count at today's current low at 1070.66, then after the next rally up forms 3 wave from there, we'll have to watch closely what happens next - the low of 1070.66 would have to hold. Obviously, if we haven't yet completed wave (B), we'd have to do this following the next 3 wave move up from wherever wave (B) ends.

17:12 BST - SPX Update: 1 min close up

Here's my favoured count for today's move down, updated from earlier:

SPX 1 min close up:


Again, it could be counted as a complete wave (1) down to the latest low at 1070.66, in which case, instead of a wave 4 of (1) bounce, we'd get something deeper for wave (2). Also, although I've put in the wave 3 label, it may still have more to go. It looks like 5 waves rally close up, but it might just be the 1st wave of wave 5. I think it would look best if wave 3 did end at the curent low, but I'm not in control!
 

15:12 BST - SPX Update: 1min close up

We'll have to wait and see how this develops, but here's a provisional count for this early sell off:

SPX 1 min close up:


This may turn out to be too bearish and we may now have completed wave (1) down from yesterday's high. On this labelling, if we are in iv of 3 of (1), we need to stay below 1087.77 in this wave iv. If we don't, I'll probably consider wave (1) complete at today's low and so we would then be in wave (2), with an invalidation point at yesterday's high.

12:19 BST - SPX Update: 15 min pitchforks and technical indicators

I've update the 15 min chart from yesterday to adjust the red down fork (the original was pretty much invalidated with yesterday's rally) and to add in the new upward fork I mentioned at the end of my last posting of this chart (see here), plus a smaller downward fork. Its cluttered, but it shouldn't be too difficult to see the various forks.

SPX 15 min pitchforks:


The upward black fork doesn't look like it is going to have a real influence on price since the rally into it failed to get to the median line, which is not bullish, and then broke down out of the fork late yesterday.

Yesterday's rally seems to have been a back test of the green fork which we broke down out of with the early decline. Again, the pullback from there doesn't inspire bullish feelings.

Yesterday's high is now the pivot which I'm using for the adjusted red down fork. We'll just have to wait and see once again whether or not this fork gets validated. If we just drop down into it towards the median line of if we drop a bit and then rally to the upper line and then drop back down, I would consider it to be valid and would expect it to have some further influence on price.

You'll see I've also sketched in a smaller downward fork in pink which, if we are going to drop, may be the fork that exerts the most influence on price initially. Its pretty much contained within the upper half of the red fork.

So, those are the forks to watch for the moment.

Looking at the indicators, you can see that they confirm what I mentioned in relation to the 60 min chart which I posted last night (see here), that the rally yesterday was somewhat weaker than the rally on 17 August. As I said in relation to the 60 min chart, there was no bearish divergence as such since price wasn't making a higher high while these indicators made lower highs. However, it does seem to highlight some underlying weakness. 

Of course, if we rally hard again, that may all work itself off, but for the moment, the chart suggests that if we do rally to a higher high (I discussed the possibility of this in relation to the 60 min chart) it may just be providing the opportunity for these indicators to set in actual bearish divergence against a new price high.

If we do rally, the bearish case will want to see price fail at the lowerline of the black fork and the upper lines of the pink and red forks, or thereabouts. Otherwise, as I'm sure you can see, there is another upward fork we can draw that may take prices higher. I haven't drawn it in, but it is based on the low made early yesterday, the high of the day and the low made at the end of the day.


9:36 BST - Dollar Update: 25 min chart

Yesterday I showed a potential head and shoulders pattern on the dollar, which gave rise to the possibility of invalidating the main count on the chart which has us in wave iv of the first impules wave up from the low at 80.085. You can see yesterday's post here.

In the absence of an impulsive move up, the risk of further downside remained, in my view. Well, we may have had a 5 wave move up (it could still be incomplete even though I've put the 5th wave label in) with the dollar bouncing right at the neckline of the head and shoulders instead of breaking below it. Here's the updated chart:

Dollar 25 min chart:


If its right that we have completed, or are in the process of completing, 5 waves up from the low at 81.192, which I'm labelling wave [1] of v up, we'll have to expect a wave [2] retracement. The critical level to watch for this will be the low at 81.192. That must not be taken out, otherwise, something else is going on with the count.

If things are very bullish, this move up may just extend and if it does, it may be that it ends up being the whole of wave v, not just part of it as I'm currently labelling the move. That's something to look at if it happens, but the level to watch would still be 81.192.

I'm continuing to count the decline from 83.016 as wave iv of (i) up from the 80.085 low. Its possible that that high was actually wave (i) and this retracement to 81.192 has been wave (ii) and I may have to make this the main labelling at some point, for example, if the next rally starts to look like a 3rd wave up rather than a 5th wave of one lesser degree. For the moment, however, the retracement didn't do anything to invalidate the wave iv count, so I'll stick with it.

I've left the pitchforks that I've been following on the chart for anyone interested. 

You can see how the drop to the neckline of the head and shoulders was also the median line of the red fork. That low enabled the drawing of the green fork. The wave I've labelled as wave (1) of [1] hit the upper line of the red fork, fell back from there but was unable to get down to the median line of the red fork, which was bullish. It then rallied up above the red fork, paused at the median line of the green fork, then bust up through it to the upper line. All good stuff.