Menu

Tuesday, 6 July 2010

22:21 BST - SPX Update

Still no resolution yet to the question whether we're in a deep 2nd wave retracement of the decline from 1131.23 or a shallower 2nd wave retracement of the decline from 1082.60 or a 4th wave retracement or something more bullish that will take us back above 1131.23.


Remember, the Options listed below are the different ways to count the move down from 1219.80. There are 5 that I'm following and they are set out on the 60 min counts page


On the chart of each Option I have labelled one of the 4 Counts (numbered 1,2,4 and 5) that I'm following for the decline from 1131.23. Each of these Counts could apply to any one of the Options, though what they mean may differ depending on which Option you are looking at.


Here's how things stand after today:

Option 1 - Wave (ii) of [iii] topped at 1131.23

7 min chart:


I've applied Count 1 to the chart of this Option. It assumes that we completed 5 waves down from 1131.23 at the low of 1010.91. From that low, I've labelled an incomplete double zig zag.  It assumes we've completed  the first zig zag in a double zig zag at today's high. We are now in an [X] wave before the next leg of the rally to complete the 2nd wave. It will probably have to be a zig zag in order to retrace a decent amount of the drop from 1131.23.


This Count is invalidated below 1010.91. If that happens, then one of the other Counts, 2, 4 or 5, is in operation and we have not yet completed 5 waves down from 1131.23.

Option 2 - Wave [ii] topped at 1131.23

7 min chart:


This is Count 2 which has us in the 5th wave of a 5 wave drop from 1131.23 extending.

The low of 1010.91 is labelled as the 3rd wave of the 5th wave and today's high is labelled as the 4th wave. I've labelled the decline from today's high as part of the 5th wave which will complete 5 waves down from 1131.23.

The Count as labelled will be invalidated above 1042.50. In that event, I'll look to the incomplete double zig zag count I was following today and expect a deeper wave [4] retracement.


Option 3 - Wave [iv] of an ending diagonal completed at 1131.23

7 min chart:


I've also applied Count 2 to the chart of this Option. So, we have started the 5th wave down to complete 5 waves down from 1131.23. Again, the Count as labelled is invalidated above 1042.50. Remember that for this Option to remain valid, we need to stay above 999.83 for the 5th wave of the leading diagonal.


The bullish alternative, that we bottomed in wave [v] of a leading diagonal down from 1219.80 at the low of  1010.91 low remains. It will only be invalidated if we drop below 1010.91.

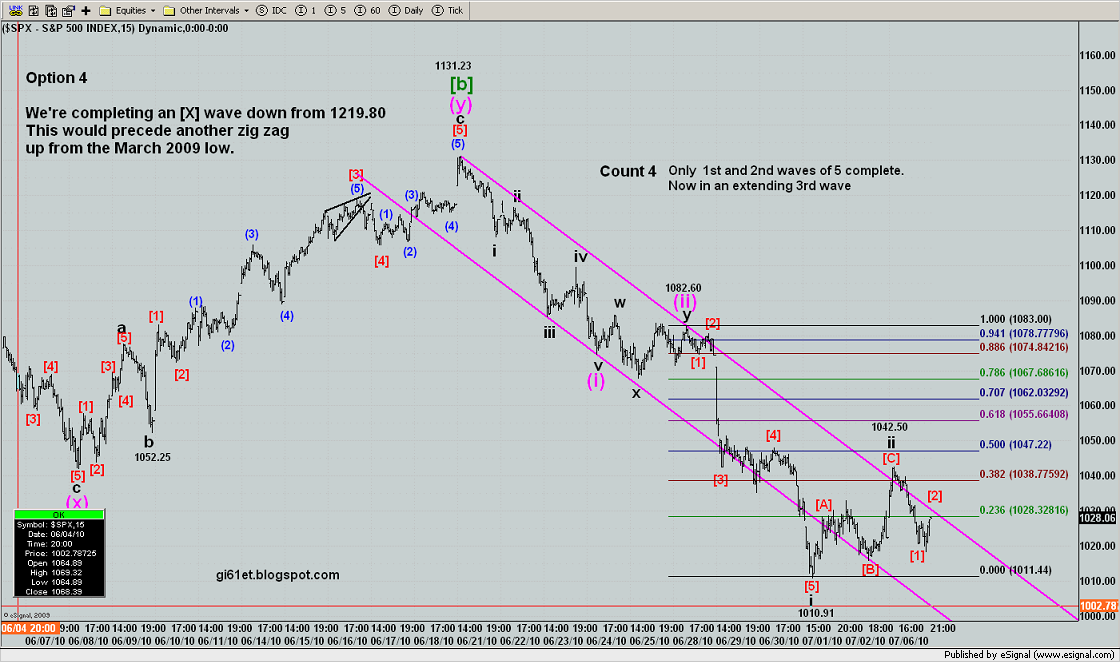
Option 4 - Wave [b] of minor Y within intermediate [X] topped at 1131.23

15 min chart:


I've applied Count 4 to the chart of this Option. It puts us in an extending 3rd wave down from 1131.23. I've marked today's high as the end of wave ii of (iii), but it could have more to go if we are seeing an incomplete double zig zag from 1010.91.


The Count as labelled is invalidated above 1042.50 and if that happens, I'll switch focus to the incomplete double zig zag count and look for a deeper retracement in wave ii of (iii).


The retracement can't exceed 1082.60 if this count is correct.
Option 5 - Minor wave X within intermediate wave [X] topped at 1131.23. Now in minor Y down

8 min chart:


On the chart of this Option I've applied Count 5 which puts us in an extending 3rd wave off the 1131.23 high, but we'd be further along into it than under Count 4 shown on the chart of Option 4 above - we'd be into wave v of (iii) now, if we topped in wave iv at today's high.

The Count as labelled is invalid above 1042.50 and provided we stay above 1010.91, the incomplete double zig zag count will come into effect.

For completeness, here are the two charts I was following today, which label the move from 1010.91, one showing a double zig zag complete at 1042.50 and the other showing a double zig zag still in progress:


Double zig zag complete:


On-going double zig zag:

19:22 BST SPX Update

Possible 5 waves down from today's high complete for wave [1] of v (but it looks like it could extend):

SPX 1 min chart - double zig zag complete at 1042.50:


On the single zig zag count, it may be a complete x wave:


18:36 BST SPX Update

Counts quite nicely as 3 waves down so far. On the completed double zig zag count posted earlier, it would be the first 3 waves down in an impulse. On the single zig zag count, it could just be a zig zag for an X wave.

Here's the completed double zig zag count on a 1 min chart:


If we take out 1035.81 on this current rally from the low, which would be wave (4), that invalidates the implse wave count as labelled.

17:27 BST SPX Update

Here's a possible count for a top to this move up from 1010.91. Its the double zig zag count shown earlier but now complete, with a leading diagonal 1st wave down in the next down leg.

Today's high is the invalidation point for this count. 

SPX 1 min completed double zig zag:


On the single zig zag count, the move off today's high could be the A wave of an X wave . That would become the main count if we take out today's highs.

16:25 BST SPX Update

I've been following 5 Counts for the move down from 1131.23, but I've now dropped what was Count 2 which had an extending 5th wave containing 3 nested ones and twos within it. That's because it had reached the same position as the labelling I was showing for Count 3 which was an extending 5th wave but with only 2 nested ones and twos within it. So, that leaves 4 counts for the decline from 1131.23 (what was Count 3 is now Count 2, but I've left the other Counts numbered as before to avoid confusion if looking back in the archives).


Here are the charts for each of the counts:


Count 1 5 min chart:


Count 2 5 min chart:


Count 4 10 min chart:


Count 5 10 min chart:


You can see that on all the Counts we are at resistance. For Count 1, this may only be a temporary stopping point. For the other Counts it may be more likely to halt the retracement, but let's see.


16:07 BST SPX Update

The moves up from 1010.91 can be counted in various ways: a single zig zag, a double zig zag or the start of an impulse. Taking out 1032.95 negated the completed double zig zag count from Friday, but these other possibilities remain valid.

Here's the single zig zag and the alternative (1), (2) count on a 1 min chart:


I've marked wave [C] as complete, but its quite possible there's another high to come. Wave [C] is about 1.618 x wave [A] on my labelling.

If we're in a single zig zag, then if we made 5 waves down from 1131.23 to 1010.91 (see Count 1 on the chart of Option 1 from Friday night), we're probably going to see an X wave here before another zig zag up to achieve a deeper retracement for wave ii. 

If we're in a 4th wave (see the chart of Option 2 or Option 5) , this single zig zag may well be the whole of the retracement. 

If we're in a 2nd wave but only retracing the decline from 1082.60 (see Option 4), this retracement (nearly 50%) may be enough to complete it).

And here's the double zig zag on a 1 min chart:


It shows a further high required, but could be complete at today's high. If this count is correct, then its likely we are only in a 4th wave retracement (see Options 2 and 5) or the 2nd wave retracing only the decline from 1082.60 (see Option 5).

13:58 BST - ES Update

Futures made a new low below the 1 July lows overnight. However, from Friday's high to the new low looks more like 3 waves rather than 5, so it may still be part of an on-going 4th wave corretion (or 2nd wave - see the SPX update from Friday night) rather than  a 5th wave down:

ES 5 min:


On the above chart, which is the nested ones and twos  count (Count 5) I've shown either a completed 4th wave at Friday's high, or, the 4th wave still in progress. The latter may seem more likely at this stage. If it takes out Friday's high, then it will become the main labelling for this count.

Saturday, 3 July 2010

16:58 BST - SPX: 60 min counts page updated

I've updated the 60 min counts page to the close on 2nd July 2010.

This page shows the 5 Options I am following for the decline from 1219.80 and they give context to the 5 Counts I have on the shorter term charts, which I update daily, for the decline from 1131.23. 

11:57 BST - Updated Pages

I've updated the Impulse From March 2009 page and the Zig Zag From March 2009 page.

On each I've shown some potential levels to watch out for. 

I've also addressed (on the Zig Zag page) an issue I keep coming back to - if we're in primary wave [3] down from 1219.80, whether I should be labelling the decline on the basis that we have completed minor wave 1 of intermediate (3) of primary [3]. My labelling assumes that we are still in minor wave 1. Obviously, I can't be certain that this is correct, but I've explained why it could be.

Friday, 2 July 2010

21:32 BST - SPX Update

No resolution yet to the question whether we're in a deep 2nd wave retracement of the decline from 1131.23 or a shallower 2nd wave retracement of the decline from 1082.60 or a 4th wave retracement or something more bullish that will take us back above 1131.23.


Remember, the Options listed below are the different ways to count the move down from 1219.80. There are 5 that I'm following and they are set out on the 60 min counts page. This is updated at least weekly.

I have a shorter term chart for each of those Options (which are updated as the price action develops) and I have put on each a different way to count the more recent moves, currently from the high of 1131.23. Each of these counts could apply to any one of the Options, though what they mean may differ depending on which Option you are looking at.

So it might seem confusing to have so many Options and counts, but its actually quite straightforward.

Here's how things stand after today:

Option 1 - Wave (ii) of [iii] topped at 1131.23

7 min chart:


For this count I'm assuming we're in the on-going single zig zag count that I posted earlier, since its a wave ii retracement, so ought to retrace more than the rally from 1010.91 has done to date.  Of course, a single zig zag could become a double zig zag and also note the possibility labelled on the chart, that we are only in the early stages of wave (A) of an upward correction.

This count is invalidated below 1010.91.


Option 2 - Wave [ii] topped at 1131.23

7 min chart:


For this count I'm showing the completed double zig zag I've been posting about today. It will be invalidated above 1032.95 and the on-going single zig zag will then be the most likely count. If that happens, the next invalidation point ia 1074.63 - wave [4] can't end above that.

Option 3 - Wave [iv] of an ending diagonal completed at 1131.23

7 min chart:


Again, I'm using the completed double zig zag count here. The comments made in respect of the count on the chart of Option 2 apply here, with the same invalidation points.


The bullish alternative, that we bottomed in wave [v] of a leading diagonal down from 1219.80 at yesterday's 1010.91 low remains. It will only be invalidated if we drop below 999.83.


Option 4 - Wave [b] of minor Y within intermediate [X] topped at 1131.23

15 min chart:


For this count I'm going with the on-going single zig zag. since, as a wave ii retracement, it ought to retrace more than it has done to date. You can see the retracement levels on the chart. Perhaps a target of 1047 at the 50% retracement level would be a reasonable target for a wave ii prior to a 3rd of a 3rd decline.

The retracement can't exceed 1082.60 if this count is correct.


Option 5 - Minor wave X within intermediate wave [X] topped at 1131.23. Now in minor Y down

8 min chart:


For this count I'm going with the completed double zig zag. If it takes out the high at 1032.95, then I'll focus on the on-going single zig zag count, but then it will need to stay below 1085.83, the wave i low, to avoid invalidating the count. 


So, those are the levels to watch once again. Next week should help  to determine whether we're in a 4th wave or a 2nd  wave (and if a 2nd wave, which decline we are retracing)  or something more bullish. Well,  I would hope so anyway!


Have a good weekend and to any American readers, Happy 4th of July!

20:32 BST - SPX Update

Nice! Two counts previously on this chart down, one to go:

SPX 1 min  - completed zig zag at 1032.95:


This count is invalidated above 1032.95. If that happens, I'll switch focus to the single zig zag count posted earlier.

20:19 BST - SPX Update

OK, the sub-dividing wave (5) is out of the picture. That just leaves two counts on this chart - wave [2] or wave (4) (I've adjusted the labelling slightly). The former is invalidated above today's high. The latter is invalidated if it ends above 1024.57:


SPX 1 min - completed double zig zag at 1032.95:


19:56 BST - SPX Update

All three counts on this chart updated from an hour ago remain valid - the sub-dividing wave (5) count just managed to survive, but if that's the operative count, it probably has to have started wave 3 of (5) now:

SPX 1 min - double zig zag completed at 1032.95:


If we don't take out the low marked (X) at 1015.93, we could be in a triangle, in which case, its almost certain that we're in wave (4) rather than wave [2]. Otherwise, the other levels to watch are the same as before.

18:55 BST - SPX Update

Although the single zig zag count I posted earlier remains valid until we take out yesterday's low at 1010.91, here's what I'm seeing for the decline from today's high which assumes that the double zig zag count I posted earlier is in effect;

SPX 1 min - double zig zag complete at 1032.95:


There are three possible counts here - one puts us at the end of wave [1] down and now in wave [2] up, while the other puts us in either a continuing wave (4) of [1] or in wave 2 of a sub-dividing wave (5) of [1]. 

The continuing wave (4) count is invalidated if wave (4) ends beyond 1024.57. The sub-dividing wave (5) count is invalidated if we take out the high at 1022.62. The main count that puts us in wave [2] is invalidated if we take out today's high at 1032.95. Those are the levels to watch.

Other counts are possible, but I thought three on one chart would be enough for the moment!

15:36 BST - SPX Update

If we take out today's current high at 1032.95, invalidating the count I posted earlier showing a complete double zig zag, this may be what we are seeing:

SPX 1 min - single zig zag in progress:


Note: we may still be in the (Y) wave of [B], so taking out what I have as the [B] wave low won't necessarily invalidate this count. Only taking out the low from yesterday at 1010.91 without making a new high first will invalidate it.

15:07 BST - SPX Update

This is looking like a possible count for the rally from yesterday's low:

SPX 1 min - completed double zig zag:


The high of today is the invaildation point for this count.

If its correct, its still a shallow retracement up, suggesting we're seeing a 4th wave correction.

12:25 BST - ES and SPX Update

Its early to do so, but looking at the overnight action in the futures, it can be counted as a complete zig zag up from yesterday's lows. Here's the 5 min chart of ES:

ES 5 min chart:


As noted, however, it could just be the first zig zag in a double zig zag, especially if we're in a 2nd wave correction of the entire decline from 1131.23 (see the count on the chart of Option 1 for SPX) rather than a 4th wave correction.

During yesterday's session I posted a possible complete zig zag count for SPX and here is the updated chart:

SPX 1 min - complete zig zag from 1010.91:


Obviously, the high of 1030.32 has to remain intact for this count to remain valid.

Naturally, there are many ways to count the move off the low. Here are two on SPX which anticipate more upside to come (and would likely mean a double zig zag playing out in the futures):
SPX 1 min - single zig zag with [C] in progress as an impulse or ending diagonal:


SPX 1 min - double or single zig zag with [X] or [B] in progress as a triangle:


With the jobs number coming out before the cash open, this thing could go either way - best therefore, to wait and see once things settle down after the number, but perhaps we'll find out today whether we're in a deep 2nd wave correction of the decline from 1131.23, a shallower 2nd wave correction of the decline from 1082.60, a 4th wave correction or a rally that's going to take us back above 1131.23 (see last night's SPX update).
 

11:14 BST - Dollar Update

Here's the daily ichimoku chart of the dollar:


You can see that it is still in an uptrend, but, the warnings of a possible trend change shown in the 26 June update, remain and have increased: price is below the turning and standard lines, the turning line is below the standard line and the lagging line is below price and slipped below its first line of support from the turning line. As long as this persists, the shorter term trend is down, even though the daily uptrend is intact.

You can see that price is now in the cloud and is also in the middle of an area of price congestion. The lagging line is coming down to its next area of support, the standard line - if the uptrend is to continue, these support areas will  hold. 

What we need to see is price move back up above the cloud, getting above the turning and standard lines. I'll be keeping a close eye on the lagging line because even if price does manage to move up as described, if the lagging line can't get back above the price line, that would be a warning that the move up in price may fail.

At the moment, the action here is consistent with a 4th wave pullback as shown on my currently favoured count.

If price gets below the cloud and the lagging line loses support from the standard line and heads down to the cloud, then, provided the lagging line gets support there, we may see things turn back up, as happened in December 2009 (see the highlighted circles on the chart).

Such price action would probably be too much of a pullback for a 4th wave and is likely to mean that intermediate wave (2) is playing out as highlighted in my last update (its Option 1B on the Dollar page).

On the 60 min timeframe, things still look decidedly bearish:

60 min ichimoku:


Yesterday's decline took price and the lagging line well below the cloud. Since yesterday's low, price has only managed to go sideways. Its flip flopping above and below the turning line at the moment, having moved above it earlier.  

So, currently, there's no sign of a trend change on this timeframe. 

At the moment, there is a risk that a new low, which would look like 5 waves down from where I have the (x) wave high, may be playing out, meaning either we are in a (c) wave down from there, so we'd be at the end of an (a)-(b)-(c) correction from 7 June instead of the (w)-(x)-(y) I've labelled (see the alternative numbered 1 in my last update), or there's the even more bearish possibility that its only wave a of (y) (see the alternative numbered 2 in the last update)

What I'd need to see to start thinking we might reverse this donwtrend is price move more convincingly above the turning line and the turning line start to point upwards. Any rally in price must move the lagging line above the price line, otherwise its not going to be convincing and would suggest to me that the rally will likely fail. Of course, even if these things happen, it will all be happening below the cloud, so would only be initial signs of a trend change, not a confirmation - still tradeable to the upside, but with caution of course.


9:27 BST - SPX Ichimoku Update

Here is how things look on the daily and 60 min ichimoku charts since I last looked at them on 23 June (see here):

Daily ichimoku:


The bearishness in this chart has been maintained. The turning line (blue), which had moved above the standard line (red) did turn back down and should fall back below the standard line soon. Essentially, everything looks as it should in a downtrend and on this timeframe, there is no sign yet of an end to it.

I've highlighted the areas of price congestion which represent support - we are right in the middle of it now. Prices may therefore chop around here for a bit, but if things are really bearish, as the ichimoku chart suggests, they may just fall right through into the void highlighted in blue, where there is very little support on this timeframe, down to the 950 level.

Looking at the 60 min chart:


The signs of a change in trend from up to down that were appearing on 23 June, did play out. Prices did attempt to rally back up, but found resistance at the turning line and the lagging line just failed to get above the price line, which, as mentioned on 23 June, would probably mean that the rally in price would fail.

Everything is firmly in a bearish configuration. The turning line has been doing what it should in a downtrend - providing the first line of resistance to price. If price breaks above it, then the next line of resistance should come from the standard line. I've also highlighted in green the areas of price congestion which are likely areas of resistance on normal TA and which should hold price back in a downtrend.

So, despite yesterday's recovery, there is nothing on this chart that suggests the downtrend is over. Warnings that it is will start to flash if price gets above the turning and standard lines and the lagging line gets above the price line. These signs will be something to take heed of, but if price remains below the cloud while all this is happening, it would only signify a temporary halt of downward action and not a change in trend.

Thursday, 1 July 2010

21:35 BST - SPX Update

The bottom that was expected does appear to have occurred today, but whether we are now in the process of retracing the whole of the decline from 1131.23 to 1010.91 in a 2nd wave or a substantially smaller portion of it in either a 2nd or 4th wave (or the whole of the decline from 1219.80 - see Option 4 below) remains undecided - see my post from this morning describing what a bottom in the counts I am following might mean. 

Here's how each count looks at the moment - remember, any one of the counts shown could apply to each of the Options (as to which, see the 60 min counts page for context). I've simply shown the different counts on the charts of the different Options for illustration purposes.

Option 1 - Wave (ii) of [iii] topped at 1131.23

7 min chart:


On this count, the low today completed 5 waves down from 1131.23. This means we should see a substantial retracement either in a 2nd wave (on this Option) or a (b) wave (see Option 4 for example, where 5 waves down would complete wave (a))
Obviously, on this count, the low of today has to remain intact, otherwise, one of the other counts is probably in play.

I've labelled the rally so far as waves [A] and [B] of a zig zag, but if its a wave ii as on this Option, its more likely to be a double zig zag or we're just seeing the initial waves of wave [A]. 

A likely target area for wave ii is the 61.8% retracement level at about 1085, which you can see from the chart, is the top of an area of resistance starting at about 1070.


Option 2 - Wave [ii] topped at 1131.23

7 min chart:


I've labelled the rally from today's low as waves (A) nd (B) of a zig zag on this count. The (C) wave should get it to around the 38.2% retracement level, just below an area of resistance.
As this is wave [4], it can't end above the wave [1] low at 1074.63. If it does, then this count is invalidated.

I showed ealier a possible complete single zig zag where wave (C) was an ending diagonal - if we take out today's low without a further 5 wave rally, then that is likely what we have seen.


Option 3 - Wave [iv] of an ending diagonal completed at 1131.23

7 min chart:


The comments made in respect of the count shown in the chart of Option 2 apply here also, with the same invalidation point.

If the alternative I've indicated on the chart applies, on this Option it would mean the end of wave [v] of the leading diagonal and we would now expect a deep retracement of the whole of the decline from 1219.80. The first warning sign that this might be happening would be if we exceed the wave i low on this retracement, which would invalidate this count, but ultimately, taking out the wave [iv] high at 1131.23 would be the deciding factor.


Option 4 - Wave [b] of minor Y within intermediate [X] topped at 1131.23

15 min chart:


On this count I'm expecting a 2nd wave rally, but it would only be retracing the decline from 1082.60. On that basis, a single zig zag may suffice, so that's how I've labelled it.


Taking out the high of 1082.60 would invalidate this count.


Option 5 - Minor wave X within intermediate wave [X] topped at 1131.23. Now in minor Y down

8 min chart:


On this count, I'm looking for a 4th wave rally, for which a single zig zag shoud suffice on the basis of the way I've labelled today's move. If we take out today's low without a further 5 wave rally, its likely that the completed zig zag I posted earlier was the correct count. We would then be into wave iii of (iii) down.


The invalidation point here is the wave i low at 1085.83.