Menu

Friday, 22 October 2010

21:13 BST - SPX End of day Update

You can see the bigger picture for each of the following counts on the charts of Options 1, 2 and 3, respectively on the 60 min counts page.

Bearish count:

Chart 1: SPX 1 min - bearish count:


This assumes a top to the rally from the August low at the high of 1189.43.

With the sidways action today, its unclear whether wave (2) has ended, as labelled, or whether its still in progress, with another up leg to come. 

Taking out 1183.93 will invalidate the little i-ii that I've labelled. Given the sideways action today, I think its probably more likely that we'll see more upside in wave (2), but until that high at 1183.93 is taken out, I'll leave the labelling as it is.

If there is more upside, it has to stay below 1189.43 for the count to remain valid.

If that high is taken out, I'll be looking to the following count as likely playing out.

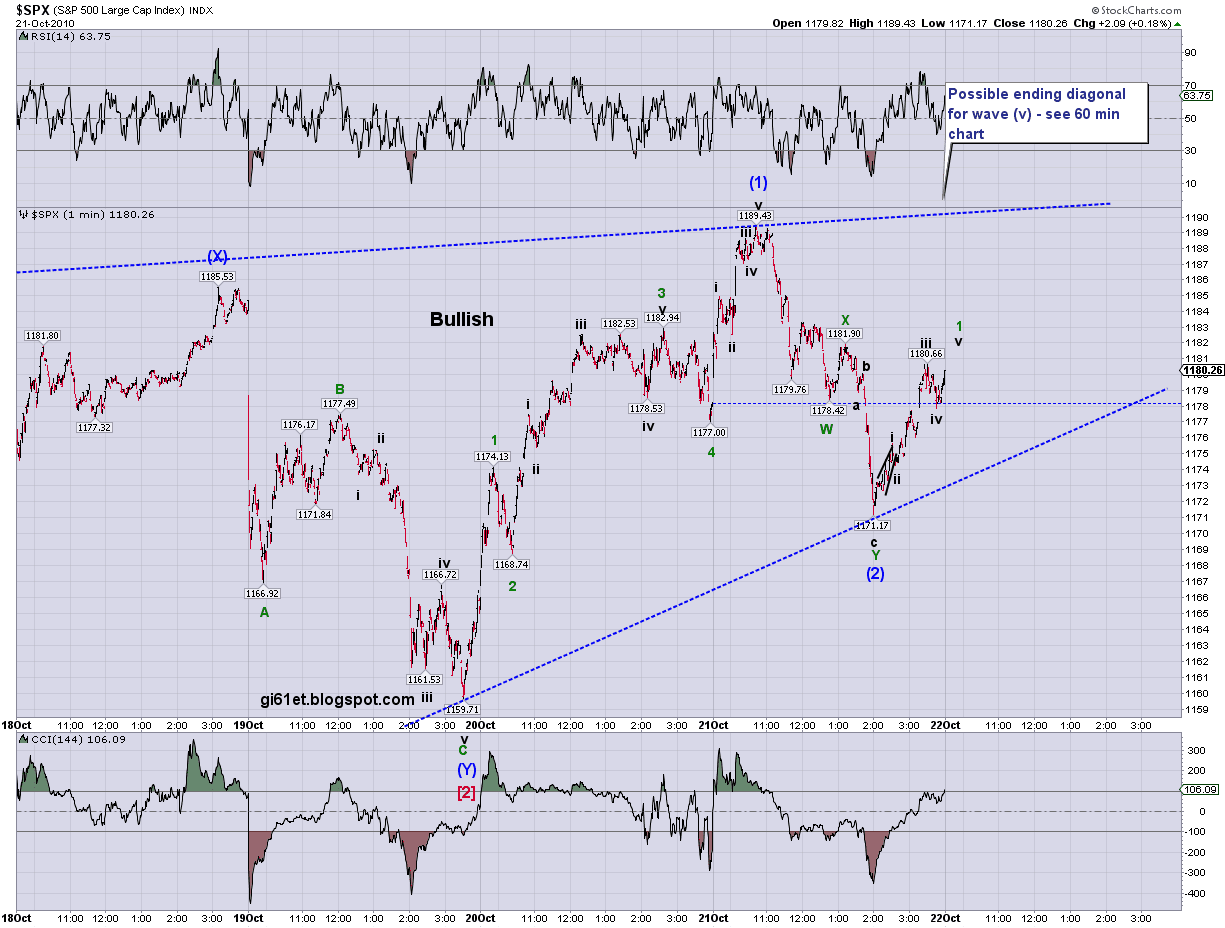
Moderately bullish ending diagonal count:

Chart 2: SPX 1 min - ending diagonal:


This count puts us in an ending diagonal wave v in the rally from the August low.

As mentioned in the update posted last night, if we're in wave [5] of this diagonal, it has to stay below 1200.89 to remain valid and it has to take out the high labelled wave [3] at 1189.43.

If we exceed 1200.89, it could either mean that we're only in wave [3] of the diagonal or that the more bullish count below is playing out.

If we're still in wave [3] of the diagonal to a new high for the rally from the August low, then once its complete, wave [4] will have to stay above the dotted blue line for the diagonal to remain valid.

If we take out the low at 1171.17 before making a new high at this stage, I'd start to question the diagonal. However, it won't be ruled out until we take out 1159.71 or the dotted blue line.

Bullish Count:

Chart 3: SPX 1min - bullish count:


This has us in a subdividing wave (v) in the rally from the August low.

Its not clear whether wave 2 of (3) is complete today or if it has more downside to go before we see more upside. More downside would make sense given that wave 2 is, so far, a very shallow retracement. If there is more downside to come, it needs to stay above 1171.17 for the labelled count to remain valid. 

If we take out that low without new highs, we may still be in wave (2), so the overall count will remain valid. However, we'd then have to stay above 1159.71 in wave (2) to keep that count alive.

At the moment, I'm tending to prefer the bearish count given the technical picture outlined in my earlier post. However, if we take out the high at 1189.43 and invalidate that count, then my preferred count will be the ending diagonal, again, given the current technical picture and also because its probably more likely to result in a wave v that is more in proportion to wave i in the rally from the August low than the bullish count shown in Chart 3.

So, for the moment, the levels I'm watching are 1189.43 (to keep the bearish count on the table), 1171.17 (taking this out might be a warning that the ending diagonal or the bullish counts may not be playing out, but won't invalidate them) and 1159.71 (taking this out will rule out the ending diagonal labelled and the bullish count). I'm also watching the dotted blue line on Chart 2 above, since a drop below that will rule out the diagonal count shown.

Have a great weekend!

19:29 BST - SPX Update on the bearish, moderately bullish and bullish counts

Quick update on the counts:

Bearish:

SPX 1 min - bearish count:


Its not clear if wave (2) is complete. There's room for it to go higher. 1185 is about the 78.6% retracement level.

The sideways action today suggests a corrective move, but whether it precedes another leg higher to complete wave (2) or the next leg lower remains to be seen.

Moderately bullish ending diagonal:

SPX 1 min - ending diagonal:


Here, wave (B) of [5] of the diagonal may have more to go to the downside, but can be counted as complete now.

Bullish:

SPX 1 min - bullish count:

As with the ending diagonal count, wave 2 may be complete now or may have more downside to go. If there's more downside, it has to stay above 1171.17 on this count.

14:39 BST - SPX Update - Still possible we topped at 1189.43

With the move above 1181.90, the close up count of the move from 1189.43 to yesterday's low  shown in Chart 2 of yesterday's end of day update has been invalidated. However, there remains a bearish count that may be worth keeping in mind. Here it is in close up, showing 5 waves down from the high at 1189.43 rather than the (1)-(2)-1-2 count that was previously labelled:

SPX 1 min - bear count close up:

This count has a rather out-sized wave 4 of (1), compared to wave 2 of (1). However, that doesn't invalidate the count, so I'll keep it on the table as the bear count until it gets invalidated by a move above 1189.43, when the more bullish counts shown in yesterday's end of day and subsequent update will come into focus.

8:39 BST - SPX Update: Conditions are in place for a top - price action has yet to confirm

Technical signs suggest that the market ought to be at or near a top. Here's the daily chart:

SPX Daily:


As you can see, the rally from the August low has been crawling up the median line of the pink pitchfork and, of course, it can continue to do so. 

The technical indicators should be a concern on the bullish side, however:

- the CCI seems to be stuck under +100;

- the MACD histogram has been showing significant bearish divergence;

- the RSI failed to make a new high with the market yesterday;

- the MACD is rolling over;

- the stochastic has turned down.

CBOE Equity Options Put/Call Ratio:


The 5ma has moved above the 10ma and the 10ma is itself moving up. However, both remain contained in the pink downward channel (bullish for the market).

As I've said before, technically, the action of the moving averages is a sell signal, but while they are below the blue dotted line, the risk of false signals is high.

A decisive break above the blue ine and out of the pink channel is needed. 

For the moment, this suggests a sell, but with caution.

The McClellan Oscillator broke the bear flag I had drawn in and failed to break above the red channel, which seems rather bearish along with the negative divergence it has displayed as against the rally in the market.

SPX Percent of Stocks Above the 50ma:


This triggered a sell signal with a break below its 13ma on 19 October.

NYSE $Tick:


The NYSE Tick continues to display bearish divergence against the market, suggesting some real underlying weakness.

However, until we actually see some price action to confirm that a top to the rally from the August low may be in, price can continue to creep up, as we've seen.

I've bored myself silly repeating numerous times over the last few weeks that the price action required is a clear impulsive 5 wave decline that breaks some significant price level. In elliott wave terms, this means three 5 wave declines linked by two 3 wave rallies with no overlap.

So far, on various occasions, we've seen an initial 5 wave move down that looks promising as the start of a larger 5 wave decline, followed by a 3 wave rally and then a second 5 wave move down. However, they've subsequently turned out to be part of a larger 3 wave decline when the second 3 wave rally has overlapped the low of the first 5 wave decline. This is what we saw yesterday, with the late rally turning the move down into yesterday's low into a 3 wave move. The best play in recent days has been to go long when you see a possible end to the second 5 wave move down.

It remains possible that the bearish count shown in Chart 2 of yesterday's end of day update will play out. Certainly, with the invalidation point so close by, it could be worth a short trade. However, if you want to play it safe, the benefit of the doubt has to be given to the upside in these circumstances and you have to wait for clearer price confirmation of a potential top.

Thursday, 21 October 2010

21:21 BST - SPX: 60 min counts page updated, plus a close up of the potential ending diagonal count

I've updated the charts on the 60 min counts page. Option 2 now shows the ending diagonal count I mentioned in the end of day update. If the bearish count shown in Charts 1 and 2 of the end of day update is invalidated, the ending diagonal will become my preferred count.

Here's a close up from the wave iv low at 1131.81:

SPX 1 min - close up of ending diagonal count:


As mentioned in the end of day update, assuming this labelling is correct, wave [5] of the diagonal must stay below 1200.89. However, under the rules, it has to take out the high of wave iii at 1189.43.

If things are really going to drag on, we may still in fact be in wave [3] of the diagonal. If this is the case, wave [4] will have to stay above the dotted blue line I've sketched in, otherwise the lines of the diagonal will no longer converge and it will no longer qualify as a diagonal.

21:18 BST - SPX End of Day Update

Here' the bigger picture for the bearish count:

Chart 1: SPX 60 min - bearish count:


It shows a possible complete 5 waves up from the August low at today's high.

Here's a close up from the high at wave (iii):

Chart 2: SPX 1 min - bearish count close up:


The decline from the high started off well, but with the late rally, we're left with a (1)-(2)-1-2 count that doesn't look pretty at all.

For it to survive, we have to stay below 1181.90 in wave 2 of (3).

If we take that out, its going to look like the alternate is playing out, so there'd be more upside to come. This alternate can only be ruled out if we drop below 1159.71.

Another, possibly less bullish alternate is shown on the 60 min chart of the bullish count below - a possible diagonal for wave (v).

Here's the bigger picture for the bullish count:

Chart 3: SPX 60 min - bullish count:


This shows a sub-dividing wave (v) in a continuing 5 wave move up from the August low. This would be very bullish.

Note the alternate that I've sketched in, a possible ending diagonal for wave (v), with only the 5th wave of the diagonal to come. If the 4th wave was today's low at 1171.17, the 5th wave would have to stay below 1200.89 in order to remain shorter than the 3rd wave. So, this would certainly be a less bullish count than the main count labelled.

Here's a close up from the wave (X) of [2] high:

Chart 4: SPX 1 min - bullish count close up:


It would probably look odd if we take out 1171.17 at this stage, but it wouldn't invalidate the overall count. To do that, we need to take out the low at 1159.71.

So, its nice and simple - taking out 1181.90 calls the bear count into question and will probably cause it to revert back to a bullish count using the alternate labelling shown on Chart 2 above or the diagonal shown in Chart 3 above.

Taking out 1171.17 will raise questions concern on the bullish count but won't eliminate it. Taking out 1159.71 will rule it out.

18:57 BST - SPX Update

What was the moderately bullish count I've now re-named the bearish count. Here's what I'm seeing currently:

SPX 1 min - bearish count:


Be warned - as I said earlier, until we take out 1159.71, there's a risk that we only saw wave i of (v) at today's high, in which case, this count would revert to bullish.

Taking out the high at1181.90 at this stage is going to cause concern on this bear count.

Here's the bullish count:

SPX 1 min - bullish count:


The decline could be forming an A-B-C or it could be a W-X-Y, with W at the low of 1178.42. We have to stay above 1159.71 to keep this ocunt on the table.

16:34 BST - SPX Update

Well, its possible that we've seen 5 waves up from 1159.71. Here it is on the moderately bullish count:

SPX 1 min - moderately bullish count close up:


We have what looks like 5 waves down from today's high - now we need to see any retracement stay below that high.

Until we take out the 1159.71 low, however, the risk of further upside remains since we could just have seen wave i of (v) complete at today's high. Taking out the 1159.71 low would eliminate this possibility.

16:02 BST - SPX Update

With the new high today, the immediately bearish count in Charts 1 and 2 of yesterday's end of day update has been eliminated, leaving the moderately bullish and bullish counts.

Here's the moderately bullish count, the bigger picture for which was shown in Chart 3 in yesterday's end of day update:

SPX 1 min - moderately bullish count close up:


Its possible that we've got 5 waves from the wave (iv) low to today's high, but you can see that I've allowed for another dip and rally. If we were to take out 1177.00, I'd be thinking that the 5 waves that could be wave (v) had completed, but I'd then want to see a swift decline taking out the wave (iv) low.

Here's the more bullish count updating Charts 4 and 5 from yesterday's end of day update:

SPX 1 min - very bullish count close up:


Here too, we may have topped in 5 waves up from the wave [2] low, but I've allowed for another rally.

If we have topped or nearly topped, then the alternate labelling of this rally from the wave [2] low will be more appropriate, making that rally only wave (1) of [3].

Dropping below the wave [2] low at 1159.71 would invalidate this count. While we're above that level, further upside should be expected.


Wednesday, 20 October 2010

21:16 BST - SPX End of Day Update

You'll see from the 60 min counts page that 5 waves up from the August low is what I'm looking for on all three Options shown, from the very bearish through to the very bullish. What 5 waves up from that low means will depend on which of those Options is playing out. To determine that, we'll have to wait and see what sort of decline we get once we actually see a top to the rally, if we haven't already seen it.

In the meantime, here's the bearish count which assumes a top at 1185.53 (you can see the bigger picture of this count on the 60 min counts page):

Chart 1: SPX 1 min - 5 waves up from August low complete:


Obviously, we can't now move above the high at 1185.53 if the main labelling  is correct. 

Here's a closer look:

Chart 2: SPX 1 min - 5 waves up from August low close up:


If this count is correct, we need to see an impulsive decline which, so far, we haven't see. Until we do see that, the risk remains to the upside.

If we take out the high at 1185.53, it doesn't necessarily mean that there is a great deal more upside to come in the bullish count I've been showing which puts us in a sub-dividing wave (v). Here's a count which assumes a further high to come, but probably not too much higher:

Chart 3 - 60 min alternate bearish count:


We only need 5 waves up from the low labelled (iv) to complete this count and you'll see from the count in Chart 4 below that we could be close to getting that after a wave (4) correction. So, provided wave (v) on the above count doesn't extened, a top on this count may not be far off.

Here's the more bullish count:

Chart 4 : SPX 1 min - wave (v) up from August low still in progress:


On the labelling shown, a drop below 1155.71 would invalidate this count since wave [2] of iii can't drop below the start of wave [1] of iii. As long as we remain above that low, however, the risk of further upside remains. However, falling below 1168.74 would, in my view weaken this count considerably and taking out 1159.71 at this stage would make me really start to question it.

Here it is close up:

Chart 5: SPX 1 min - bullish count close up:


Taking out the high at 1174.13 in an assumed wave (4) would invalidate the main labelling. Taking out the low at 1168.74 invalidates the alternate labelling and will begin to focus attention on the bearish count.

So, the levels I'm watching on the counts that I've labelled are 1185.53 (which has to hold if a top for the rally from the August low is in), 1174.13 (moving below which would rule out the main bullish count on Charts 4 and 5 above) and 1168.74 (taking that out would rule out the alternate bullish count shown on Charts 4 and 5). 

Then there are the 1159.71 and 1155.71 levels to watch. If we take those out, the very bullish count would start to lose credibility and then be invalidated, respectively. Ironically, such a move would be OK as a continuing wave (iv) correction on the alternate bearish count shown on Chart 3 above, so we'd still have the risk of a further high to come on that count.

20:12 BST - SPX Update on the bullish and bearish counts

Possibly completed wave [2] on the bearish count - not much room left if it isn't complete:

SPX 1 min - bearish count close up:


We really need to see something impulsive to the downside to have any confidence in this.

Here's how it looks on the bullish count:

SPX 1 min - bullish count close up:


If the main labelling is playing out, we need to stay above the wave (1) high at 1174.13 in wave (4). If the alternate labelling is playing out, the key level is the wave (2) low at 1168.74.

15:41 BST - SPX Update on the bullish and bearish counts

Here's a close up of Chart 2 from yesterday's end of day update:

SPX 1 min - bearish count close up:


The 61.8% retracement level is at about 1175. We need to stay below 1185.53 for this count to remain valid.

The alternate count shown in Chart 2 from yesterday's end of day update still stands as a possibility unless we take out 1177.49.

Here's a close up of Chart 3 from yesterday's end of day update:

SPX 1 min close up of the bullish count:


Straightforward here. We just need to stay above 1159.71.

11:45 BST - FTSE Update

If FTSE put in an important top in April, its going to have to start dropping pretty much now. Here's an updated count showing how the move since the April high may be counted - the main labelling is the bearish view, with the alternate labelling showing the bullish view:

FTSE Daily:


So far, wave [ii] on the bearish count has just exceeded a 78.6% retracement of wave [i] down.

You can see that I've labelled the move up from 5070.94 as a diagonal. On the bearish count, its an  ending diagonal for wave c of (y) of [ii]. On the bullish count it would be a leading diagonal, so it can't be wave 3, so it would have to be wave [i] of 3 - that's very bullish and means that this bullish count, on this labelling, won't be invalidated unless we drop below 5070.94.

Here's a closer look:

FTSE 60 min:


This shows only the bearish count, but the following comment on the diagonal applies equally to the bullish count.  I've labelled the diagonal from 5070.94 as complete, but we may still be in wave [5]. It can't exceed 5833.1 if its to remain shorter than wave [3] as required by the rules. In theory, wave [5] could, therefore, reach its maximum level and still not eliminate the bearish count since the April high is 5833.73.

Here's an even closer look:

FTSE 5 min:


Again, I've only labelled the bearish count. 

It looks like a diagonal down from the high at 5761.93, although I could just as easily label it as an impulse down to where I have wave (1) of the diagonal, followed by an expanded flat wave (2), with today's rally being the C wave of wave (2).

If we take out the high labelled [ii], that would mean that the diagonal is still in progress or something more bullish is developing.

Taking out the wave [4] low of the diagonal at 5597.46 would mean that the diagonal is complete on this labelleing, though it won't seal the bear case since even on the bullish count, a pullback (in wave [ii] of 3) is called for. As mentioned above, we'd really have to drop below 5070.94 to start thinking that the bullish case may not be viable.

So, taking out 5770.92 would suggest more potential upside and the bullish case might then be the focus. However, the bear case isn't invalidated unless we take out 5833.73. Taking out 5833.1 invalidates the diagonal from the 5070.94 low and would increase the likelihood that the bullish count is playing out. Dropping below 5597.46 would suggest we could see more downside, but it may only be a corrective wave [ii] on the bullish count. We'd have to drop below 5070.94 to rule that out. Dropping below today's low at 5680.43 would be a the first step in a larger down move.

Tuesday, 19 October 2010

21:07 BST - SPX End of Day Update

Today's move was a good start if we've completed 5 waves up from the August low at the high of 1185.53. You'll see from the 60 min counts page that 5 waves up from that low is required on all three Options shown, from the very bearish through to the very bullish, so what 5 waves up from that low means will depend on which of those Options is playing out. To determine that, we'll have to wait and see how far the decline from 1185.53 goes.

In the meantime, here's the 60 min chart (labelled as if Option 1 is playing out) showing the count for a top:

Chart 1: SPX 60 min - 5 waves up from August low complete:


Obviously, we can't now move above the high at 1185.53 if the main labelling  is correct. 

Here's a close up from the wave (iv) low at 1131.87:

Chart 2: SPX 1 min - 5 waves up from August low close up:


Taking out the 1163.87 wave i of (v) high ruled out the possibility that we might still be in wave iv of (v). So, the count for a top seems OK.

If the alternate labelling is playing out, we have to stay below 1177.49 in wave 2 of (3). If we don't, then, provided the high at 1185.53 holds, the main labelling stands.

However, there remains a bullish count which can't be dismissed until we drop below the low at 1155.71. Its a variation of the count shown in Chart 1 in yesterday's end of day update - I've just streamlined it by removing one set of  the ones and twos into the 1184.38 high.  Again, its a close up from the wave (iv) low at 1131.87:

Chart 3: SPX 1 min - wave (v) up from August low still in progress:


On the labelling shown, a drop below 1155.71 would invalidate this count since wave [2] of iii can't drop below the start of wave [1] of iii. As long as we remain above that low, however, the risk of further upside remains.

So, the levels I'm watching on the counts that I've labelled are 1185.53 (which has to hold if a top for the rally from the August low is in), 1177.49 (moving above which would rule out the alternate count on Chart 1 above) and 1155.71 (taking that out would rule out the bullish count shown in Chart 3).
 

17:07 BST - SPX Update on the count for a possible top at 1185.53

If the main labelling on the chart below is correct, we have to take out the B wave low at 1171.84. Doing so won't be conclusive that the main labelling is playing out. We'd really have to take out today's low to gain more confidence in it, followed by the low at 1155.71:

SPX 1 min - possible top at 1185.53:


If the alternate labelling is playing out, we have to stay above 1163.87.

15:09 BST - SPX Update - Possible top for the rally from the August low?

The chances may be increasing that this count, from Chart 2 in yesterday's end of day update, may be what we have seen playing out from the August low:

SPX 60 min - 5 waves up from August low possibly complete at 1185.53:


This shows the count as if Option 3 from the 60 min counts page is playing out, so this would be a temporary high. If Options 1 or 2 on the 60 min counts page is playing out, its a more bearish top.

Here's a close up:

SPX 1 min - possible end of 5 waves up from August low:


To be honest, however, with the market having been so strong recently, I think we need to be wary that this drop today may be wave [C] of an expanded flat wave iv. The argument against this would be that on my labelling, we had a running flat for wave ii, so if this is an expanded flat for wave iv, there's no alternation. However, alternation is only a guideline, so I think this risk is something to keep in mind.

Clearly, if we've seen a top at 1185.53, we have to stay below that high in any retracement, so that's the level to watch to the upside.

If this is still part of wave iv, then it has to stay above the wave i high at 1163.87, so that's the level to watch to the downside.

Monday, 18 October 2010

21:17 BST - SPX End of Day Update

With no significant level to the downside being breached, the trend remains up. 
 
Here's a close up of the most bullish count, the bigger picture for which you can see on Chart 3 on the 60 min counts page: 
 
Chart 1: SPX 1 min - bullish count:


Here, I'm assuming we've started wave [3] of v up. I've put us in wave (3) of [3]. If this labelling is correct, the next decline will be wave 4 of (3) of [3] and will have to stay above the wave 1 high at 1177.32. If it takes that out, then the count will need to be reviewed.

Here's the other bullish count I mentioned on Friday:

Chart 2 - SPX 60 min moderately bullish count:


As I said on Friday, I think I'm starting to prefer this count over the one shown in Chart 1 above simply because its more likely to produce a wave (v) that's in proportion to wave (i). As mentioned, because wave iii is shorter than wave i on this alternate count, wave v would be limited by the size of wave iii, which is 28.67 points. So, if wave iv ended at the low of 1171.17, for example, wave v couldn't exceed 1199.84. If wave iv ended where I've labelled at at 1172.38 then the limit for wave v is 1201.05 (I mentioned in my post earlier today that either of those lows could be counted as the wave iv low).

Here's the close up:

Chart 3: SPX 1 min - close up of moderately bullish count:


If we drop below the wave [1] high at 1181.80 on the next decline, I'd start to think that we may have topped on this count at today's high. However, better confirmation would, in my view, come if we drop below the wave iv low either at 1172.38 or 1171.17.

Here's a revised 60 min chart for an ending diagonal from the August low:

Chart 4: SPX 60 min ending diagonal from August low:


And here's a close up:

Chart 5 : SPX 1 min - ending diagonal from the August low close up:


This shows a potentially complete count for the diagonal, but be aware that wave (v) could go higher as long as it doesn't exceed 1219.22.

Taking out the low at 1171.17, where I have labelled wave b of (v), would suggest that we'd seen a top, but I'd rather see the wave (iv) low at 1166.71 get taken out.

So, following today's action the main levels I'm watching are: 1181.80, 1177.32, 1172.38, 1171.17 and 1166.71.

15:51 BST - SPX Update on the bullish, moderately bullish and bearish counts

Here's the bullish count from Chart 1 in Friday's end of day update:

SPX 1 min - bullish count:


If the labelling is right and we're in wave iii of 3 of (3), we first have to stay above 1176.12 which is the wave i high.  Take that out in an assumed wave iv and this count will look unlikely. Even if we stay above it and make a new high, subsequently taking out 1171.17 will invalidate this count.

Here's the moderatley bullish count mentioned in that Friday update:

SPX 1 min - moderately bullish count:


Here, we have to stay above the wave iv low at 1172.38. However, that low may be at 1171.17, depending on how you label the triangle, so really, I'd like to see that low taken out before I'd think this count may no longer be viable.

Here's the bearish count from Chart 2 in Friday's end of day update:

SPX 1 min - bearish count:


Pretty straightwforward here - we have to stay below 1184.38 and take out the low of wave [1] which is at 1166.71, but taking out 1171.17 would be a start.

Saturday, 16 October 2010

13:05 BST - Dollar Update

On the daily chart of the dollar you can see how stretched the bullish count is becoming, with intermediate wave (2) now having retraced nearly 88.6% of the intermediate wave (1) rally:

Dollar Daily:


You can see from the indicators that there are bullish signs appearing - bullish divergence in the RSI which is failing to make lower lows with price; bullish divergence in the MACD histogram; the MACD itself starting to show signs of turning up; and the stochastic turning up. However, this is the type of thing we've seen before, but we now need price to confirm that something bullish may be afoot.

Well, we saw something along those lines yesterday. The bar yesterday was a nice reversal bar with potentially bullish implications since it took out the prior bar's low only to then close above the high of the prior bar. Its a start, but its not conclusive of a meaningful turn - the close was right at the bottom of an area of congestion (see the yellow highlighted area). If the dollar can get above that area and turn it into support, then there might be a more solid basis for thinking that a potentially significant turn has been made.

As mentioned above, we've nearly reached the 88.6% retracement level. I calculate that level to be 75.827, so there's still a little more room to go to reach it, though yesterday's low at 76.144 may be close enough. Just an observation: wave [2] on this bullish count was a 78.6% retracement of wave [1] and .886 is the square root of .786. It would be interesting if wave (2) of [3] stopped at the 88.6% retracement level.

The case for a turn would be reinforced if there were a a potentially complete wave count.

Well, there may be, but the most obvious count to me suggests that we may still need to see another low. Here's a 90 min chart showing the move down from the June high at 88.708:

Dollar 90 min:


The count places us currently in wave (iv) of [v] of C. If this is correct, Friday's rally will be limited and we should see a further decline next week to complete wave [v]. 

Here's a closer look from the B wave high at 83.522:

Dollar 70 min:


This provides a bit more detail for wave C of (2). Within wave [v] of C, I've got an extended wave (iii). This should mean that wave (v) of [v] is unlikely to extend and, in theory, should tend towards equality with wave (i) of [v]. Wave (i) of [v] was 1.071 points on my labelling, so if we start dropping again, without taking out Friday's high at 77.131, I'd be looking for signs of a turn in the 76.060 region.

Having said all of that, with Friday's action, its very possible that wave C completed at Friday's low. You can see the alternate count I've labelled for wave [v], shown in italics.

I'd start to think that this alternate labelling is playing out if we were to break above the area between the red horizontal lines, which is the yellow area of congestion marked on the daily chart above. This is, of course, provided that that area then becomes support.

Such a move would also get us above the 200 period moving average, which would also be supportive of a possible turn.

Still, looking at the 5 min chart, this is what I see from the low at 76.144:

Dollar 5 min:


Close up, the move from the low doesn't seem to be as impulsive as it may have felt if you were only watching price action and not the charts. It counts more naturally as a corrective move in my view, consistent with the main labelling in the 70 min chart above. However, I've sketched in a possible leading diagonal from the low that may have played out for the first wave of something more bullish. There's no overlap between what I see as the 1st and 4th waves, (they'd be where I have waves (1) and (4) of wave [C] on the corrective count) so I'd consider it doubtful. Still, if price breaks above the congestion I've referred to above and turns it into support, this leading diagonal count would start to look much more convincing.

So, as I've been emphasising over the last few weeks, the key remains price behaviour. Until we see price action that is undoubtedly impulsive to the upside, the safest course continues to be to assume more downside to come.

This is especially important because there remain more bearish counts in play. One of those is mentioned as item 2 on the Dollar page - that page is considerably out of date now, but the count mentioned in item 2 remains on the table (see the numbered items under the 75 min chart - item 1 in that list warned of much further downside than we had seen at that time in the count shown in the above charts).

A less bearish alternative, but one which, nevertheless, implies possibly more significant declines to come is shown in the following chart:

Dollar Daily - Alternate overall bullish count:


This puts us still in primary wave [2] of cycle c. The low of wave b is at 70.698. If this labelling is correct, and we're seeing an expanded flat wave [2], we could easily take out the low that's considered on the counts above to be wave [2] and which is wave (A) of [2] on this count, at 74.170. 

This count would likely be ruled out by a move above the low I've labelled as wave 1 of (C) at 80.085, assuming we move above that level in the next rally, since, on this labelling, the next rally would be wave 4 of (C).

So, in summary, I'm thinking we're likely to see more downside some time next week before we complete wave [v] of C of intermediate wave (2) on the main bullish count. If we move above the 77.931 level in an impulsive manner, I'll start to think that we may have bottomed at Friday's low of 76.144. However, we'd have to see that area turned into support to gain more confidence in this possibility. Bear in mind that on the more bearish counts, its possible that a rally from around these levels may only be a 4th wave in a larger 5 wave decline from the June high. Taking out the low at 80.085 would make that less likely on the alternate bullish count shown above, but we'd have to take out the high at 83.522 before I would start to think that the even more bearish count referred to above (that has the June high as a C wave and puts us now in a very large 5 wave move down) may not be viable.