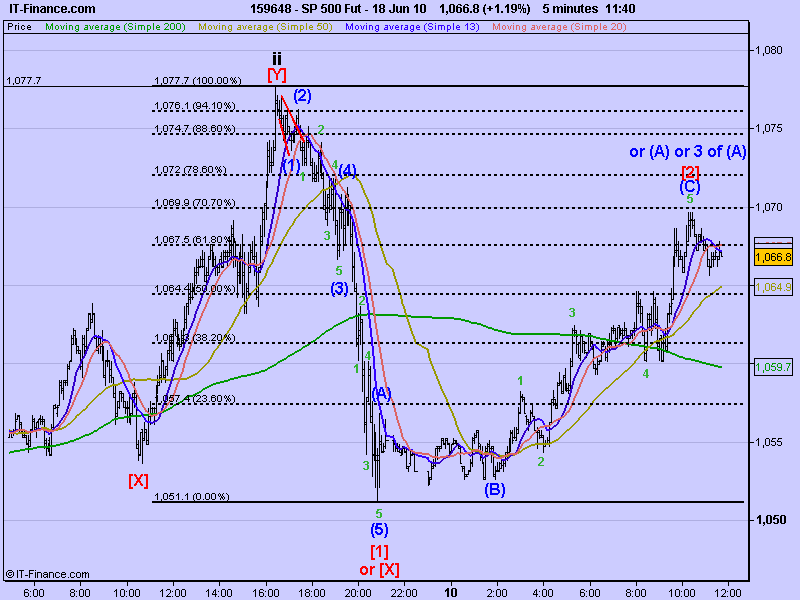
However, it also counts as 5 waves up, perhaps for wave (A) of [Y] of ii, suggesting wave ii will retrace higher, or 3 waves for the first 3 waves of (A) of [Y] of ii.
There are UK and ECB interest rate decisions, plus job numbers to come before the open, so the picture could change substantially between now and then. Still, here's a 5 min chart of how it looks for now: