Menu

Friday, 15 October 2010

21:36 BST - SPX End of Day Update

The counts shown in yesterday's end of day update anticipated that we would see some upside today, which would be the start of the next leg up on the bullish count or a corrective 2nd wave on the bearish count.

Today's action took us up, down and then sideways, but up  a little overall. So, the action hasn't doesn't anything to tell us whether we are in the bullish or bearish count.

The following charts are close ups of the action from the 1131.87 low. You can see the larger context of the following charts on the 60 min counts page.

Here's the bullish count which I've labelled as if Option 3 on the 60 min counts page is playing out:

Chart 1: SPX 1 min - bullish count:


Here, I'm assuming we've started wave [3] of v up. I've put us in wave (3) of [3], but it may be that wave (2) is still playing out, so we have some further downside to come. That's fine as long as we stay above 1155.71 in wave (2) of [3]. If we were to take out that low,  it would look like the bearish count is playing out, making 1184.38 the end of the rally from the August low. 

As I showed earlier, there is another bullish count that may be playing out and which would have less upside than the one shown above. You can see that count by clicking here.

I think I'm starting to prefer that count over the one shown in Chart 1 above simply because its more likely to produce a wave (v) that's in proportion to wave (i). As mentioned in that earlier post, because wave iii is shorter than wave i on this alternate count, wave v would be limited by the size of wave iii, which is 28.67 points. So, if wave iv ended at the low of 1171.17, for example, wave v couldn't exceed 1199.84. This count would be invalidated if we slip below 1163.87 (the wave i high) before we make a new high.

Here's the bearish count which is labelled as if Option 1 on the 60 min counts page is playing out:

Chart 2 : SPX 1 min - ending diagonal from the August low complete at 1184.38:


As you can see, I've shown a [1]-[2]-(1)-(2) down from the high at 1184.38. It may be that we're actually still in wave [2], and this will certainly be the count to follow if we take out 1181.20. In that event, wave [2] would have to stay below 1184.38 in order to keep the bear count intact. If that's taken out, I'll turn my attention to the bullish count. 

So, following today's action the levels I'm watching are: 1184.38 (to keep the bear count alive), 1163.87 (to keep the alternate bullish count alive) and 1155.71 (to keep the bullish count shown in Chart 1 above alive). 

Have a great weekend!

19:42 BST - SPX Update: alternate 60 min bullish count which implies less upside than the main bullish count

Here's an alternative on the bullish count shown on Chart 3 on the 60 min counts page:

SPX 60 min - Option 3:


This count makes the 1184.38 high wave iii of (v) and the action since would be wave iv, possibly as a triangle. It would limit the size of wave v of (v) to 28.67 points, which is the length of wave iii, since wave iii is shorter than wave i.

This count would be invalidated if we take out the wave i high in an assumed wave iv. That high is 1163.87.

19:02 BST - SPX Update - Various possibilities on both bullish and bearish counts

What a mess! A couple of possibilities on both bullish and bearish counts:

Bullish:
SPX 1 min - bullish count:


Perhaps we've started wave (3) up or wave X of (2) may have formed a triangle and we may have another drop to come in wave (2) before we start wave (3) up.

We have to stay above 1155.71 for this count to remain valid.

Bearish:
SPX 1 min - bearish count:


We may have started wave [3] down. If so, we have to stay below 1181.20. Alternatively, we may still be in wave [2] - in that case, we have to stay below 1184.38. 

Taking out today's low would help confidence in this count, but while we remain above 1155.71, the bullish count remains.

15:36 BST - SPX Update on the bullish and bearish counts

Despite the decline today, the bullish count remains intact, though I find it difficult to describe today's action as bullish. Still, here is what I think may be happening on this count:
SPX 1 min - bullish count:
Until we take out 1155.71, this remains on the table. It has room to drop further, therefore, but may be complete at today's low.
Here's the bearish count:

SPX 1 min - bearish count:
It does look like a nice impulse in the making. I've labelled a partially complete impulse for wave (1) of [3], so a new low below 1167.12 may result in a bounce in wave [2], but I'll have to see what it looks like if it happens. It may be that we've already completed 5 waves down - its difficult to tell. I'll just have to watch the how we retrace.

Thursday, 14 October 2010

21:07 BST - SPX End of Day Update

The counts shown in yesterday's end of day update anticipated a continuation of the decline from 1184.38 that had started in the latter part of yesterday's session, whether on the bullish or bearish count. On the bullish count it was wave [4] of v and on the bearish count it was part of an impulse wave down.

Today's action fulfilled that expectation and, in the process, the main bullish count was invalidated with the move below 1168.68. However, the alternative bullish count that I had mentioned remains.

The following charts are close ups of the action from the 1131.87 low. You can see the larger context of the following charts on the 60 min counts page.

Here's the surviving bullish count which I've labelled as if Option 3 on the 60 min counts page is playing out:

Chart 1: SPX 1 min - bullish count:


On this labelling, taking out 1155.71 would invalidate the count, since wave (2) of [3] can't drop below that low. If we were to take out that low,  the bearish count would become the focus, making 1184.38 the end of the rally from the August low. 

Of course, what that means depends on which Option shown on the 60 min counts page is playing out, because it could just be a temporary top prior to more significant upside.

Here's the bearish count which is labelled as if Option 1 on the 60 min counts page is playing out:

Chart 2 : SPX 1 min - ending diagonal from the August low complete at 1184.38:


I've switched back to the impulse wave off the high at 1184.38 since we didn't see a retracement deep enough to be considered as wave [2] following the diagonal I had labelled earlier.

As you can see, I've shown a complete wave [1] down, meaning we'd now be in wave [2] up. A likely retracement level might be the 61.8% area at about 1178, but watch also the 78.6% level at about 1180 and the 50% level at about 1175.

The critical level for this count is the high at 1184.38. If we take that out then I'd have to assume that the bullish count is playing out.

So, I'm watching two levels after today's action: 1184.38 and 1155.71. Taking out the former eliminates the bearish count while taking out the latter eliminates the bullish count.

19:07 BST - SPX Update : main bullish count invalidated, but the alternative stands. Diagonal from the high on the bearish count?

The main bullish count shown in the last post has been invalidated by the move below 1168.68. That focuses attention on the more bullish count I've mentioned but not previously charted in detail (I've been describing it in end of day updates). You can see it on Chart 3 on the 60 min counts page and here's a close up from the wave (iv) low:

SPX 1 min - bullish count:


It shows wave (v) subdividing. This labelling will be invalidated if we take out 1155.71.

On the bearish count, I'm starting to favour the diagonal down from the high rather than a straight impulse, though it still could be either. I've labelled a complete diagonal on the following chart:

SPX 1 min - bearish count:


If we continue to fall without a meaningful retracement for what would be wave [2] on the diagonal count, the impulse wave down will start to look better again. Obviously, for this bearish count, the high at 1184.38 has to remain intact.

17:53 BST - SPX Update on the bullish and bearish counts

On the bullish count posted earlier, the wave [4] drop is getting a bit deep, but the count remains valid so far. It now looks better as a (W)-(X)-(Y):

SPX 1 min - bullish count:


Remember, this count is invalidated below 1168.68 (in which case, my attention will turn to the more bullish count referred to over the last several days - see yesterday's end of day update and Chart 3 on the 60 min counts page).

On the bearish count, we could be getting an extending wave (5) or a diagonal (as to which, see the blue lines I've drawn in):

 
Its also possible, as mentioned in the last post, that where I have wave (3) of [1] is actually the whole of [1] down and we're now in wave [3] down. If this decline starts to extend, I'll certainly be thinking more closely about that possibility.

15:48 BST - SPX Update on the bullish and bearish counts

Here's how what I'm seeing at the moment:

First, the bullish count: looks like a possible complete wave [4] of v:
SPX 1 min - bullish count:


It would be fine for wave [4] to drop more, but it has to stay above 1168.68 for this count to remain valid.

Second, the bearish count: a possible (1)-(2)-(3) down so far:


This will be invalidated if wave (4) ends above the wave (1) low at 1179.46. In that case, we might then have a (1)-(2)-1-2 down, but I wouldn't place too much confidence in that. However, if that were the count, wave 2 would have to stay below 1182.47 for the count to remain valid. 

If we take that out, its possible that we could say that today's low was wave (5) and, therefore, wave [1] down and if we don't take out the high at 1184.38, that would be how I'd count it. At the moment however, the close up of the move down from 1182.47 to 1174.04 (which would be wave (3) on this way of counting the move) isn't the best looking 5 waves I've seen.

Wednesday, 13 October 2010

21:20 BST - SPX End of Day Update

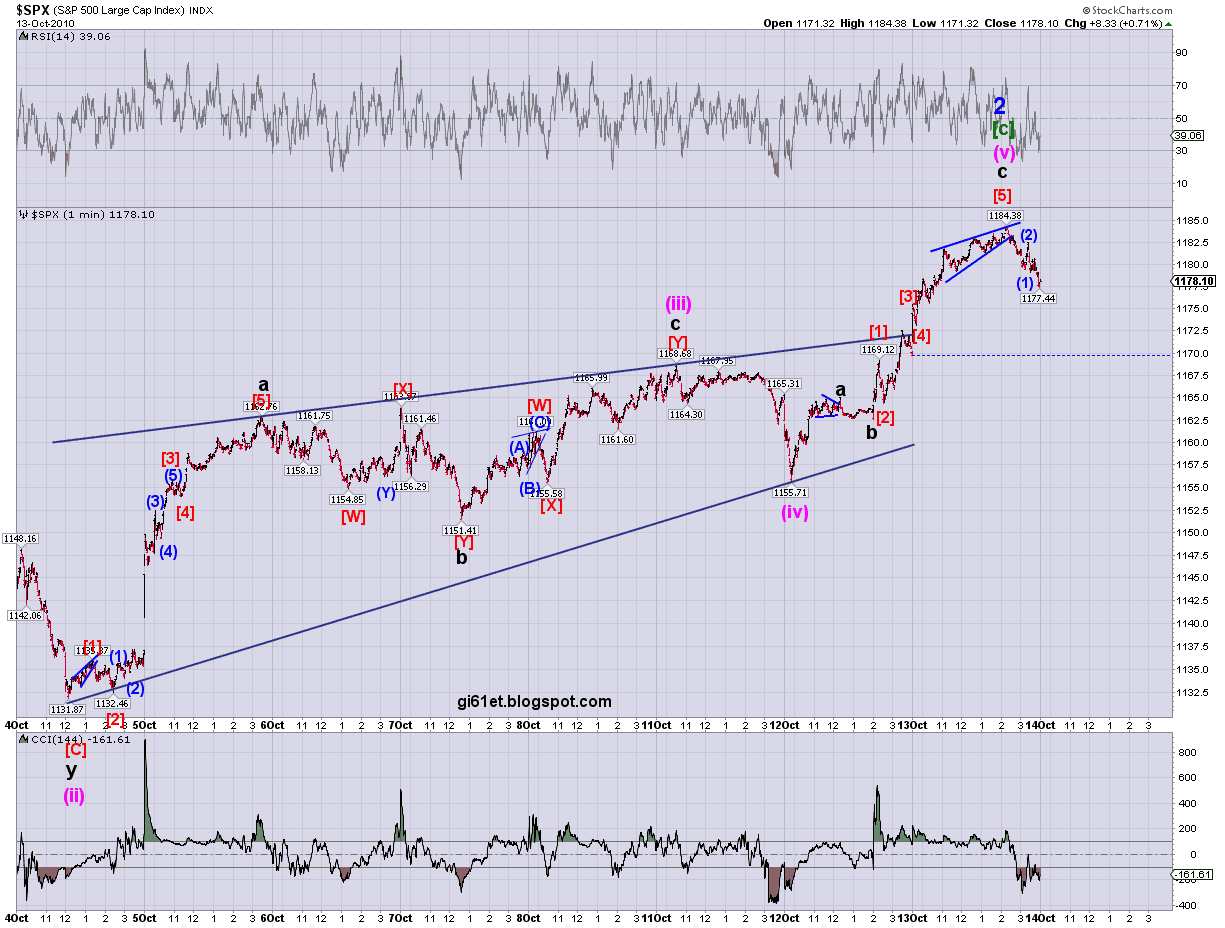
We got the new highs for the rally from the August low as envisaged by the counts shown in yesterday's end of day update. The main bearish count remains the diagonal from the August low. Here it is on the 60 min chart:

Chart 1: SPX 60 min - diagonal from August low:


This would be an ending or leading diagonal, depending on which of the bigger picture options is in play (as to which, see the 60 min counts page - the chart above assumes its Option 3).

Here's a close up of Chart 1 from the wave (ii) low (its labelled as if Option 1 is playing out):

Chart 2: SPX 1 min - close up of diagonal from August low:


As mentioned yesterday, the limit for wave (v) is 1192.52 because wave (v) must be shorter than wave (iii). We managed to stay below that level so the diagonal is still a valid possibility.

On this labelling, taking out 1155.71 would suggest that the diagonal is complete, but an earlier indication might be taking out the b wave low at 1162.55. However, an impulsive move that takes out the wave [4] of c low at 1173.14 would make me start to consider that a top might be in.

I've labelled the decline from today's high as the start of an impulse wave down, but we have to see alot more price action before we can have any confidence in this. The first test would be staying below the high I've labelled as wave (2) at 1182.47. If we take that out before making a clear 5 waves down, I'd start to think that the high at 1184.38 may only have been wave [3] of c, not wave [5].

Here's the more bullish count which has us in a subdividing wave v of (v) in an impulse wave up from the August low. This chart is labelled as if Option 3 is playing out:

Chart 3: SPX 1 min - impulse up from the August low:


Taking out 1168.68 in what I'm assuming is now wave [4] of v  would invalidate the labelling and would start to suggest that the diagonal in Charts 1 and 2 above is playing out. However, I'd feel more confident of this if we were to take out the 1155.71 level mentioned under Chart 2 above and then 1151.41.

In addition to the two counts above, there's still  the much more bullish possibility I have been mentioning over the last several days, that the high at 1163.87 was wave i of (v) and the low at 1151.41 is wave ii, which puts us now in wave iii of (v). We'd really have to take out 1131.87 to eliminate this, but taking out 1168.68 at this stage would probably render this count less likely.

So, the levels I'm watching are 1182.47, 1173.14, 1168.68, 1162.55, 1155.71 and 1151.41. The four that I've underlined are, in my view, the most important levels to watch on the counts that I've labelled.

19:32 BST - SPX Update

The market keeps grinding higher, as you'd expect when no significant level to the downside is taken out. Here's what I'm seeing at the moment. first for the bearish count:

SPX 1 min - ending diagonal from August low:


I've labelled it as complete, but there's no price action yet to support this. I'd like to see 5 clear waves down to start with and then a drop below that wave (4) low at 1173.14

Here's the bullish count:

SPX 1 min - impulse up from August low:


Here, if the labels are correct, we have to stay above 1168.68 in wave [4]. If we drop below that, I'll start to prefer the ending diagonal count above.
 

15:32 BST - SPX Update on the bullish and bearish counts

Here's the second chart from yesterday's end of day update:

SPX 1 min - ending diagional from August low:


Bottom line: if this labelling is correct, we have to take out 1155.71, though taking out that low labelled b at 1162.55, as mentioned yesterday, would help.

Here's the bullish count from the third chart in yesterday's end of day update:

SPX 1 min - impulse from August low:


If this is playing out, we have to stay above the wave (1) of [3] high at 1165.06 in wave (4).

So, essentially, while we're above 1165.06, I'd favour the upside. If we take that out now, I'd start to think a top for the rally from the August low may be in, but I'd want to see  1162.55 and then 1155.71 get taken out very quickly and impulsively.

Tuesday, 12 October 2010

21:11 BST - SPX End of day Update

With the further new high for the rally from the August low, the main bearish count is now the diagonal from that low that I showed in my last post. Here it is updated to today's close:

Chart 1: SPX 60 min - diagonal from August low:


This would be an ending or leading diagonal, depending on which of the bigger picture options is in play (as to which, see the 60 min counts page - the chart above assumes its Option 3).

Here's a close up of Chart 1 from the wave (ii) low (its labelled as if Option 1 is playing out):

SPX 1 min - close up of diagonal from August low:


As mentioned in the earlier post, the limit for wave (v) is 1192.52 because wave (v) must be shorter than wave (iii).

On this labelling, taking out 1155.71 would suggest that the diagonal is complete, but an earlier indication might be taking out the b of wave (v) low at 1162.55. Its possible that wave (v) should be labelled as a w-x-y complete at today's high (or with one more high to come) and taking out the low I've labelled as wave b would probably confirm that.

Here's the more bullish count which has us in a subdividing wave v of (v):

SPX 1 min - impulse up from the August low:


Taking out 1155.71 at this stage would make this count unlikely unless wave [2] can still be considered to be in progress. Really, on this count, the low at 1151.41 needs to be taken out to eliminate it. 

I've noted that wave v may be forming a diagonal - if today's high was wave [3], it was just shorter than wave [1], so this remains a valid possibility. I've drawn in the lines for the diagonal. If we're in wave [4], we need to stay above the dotted blue line if a diagonal is playing out.

However, remember the much more bullish possibility I have been mentioning over the last several days, that the high at 1163.87 was wave i of (v) and the low at 1151.41 is wave ii, which puts us now in wave iii of (v). We'd really have to take out 1131.87 to eliminate this, but taking out 1151.41 at this stage would probably render this count less likely.

So, the levels I'm watching are 1162.55, 1155.71 and 1151.41.

18:22 BST - SPX Update - whole of the rally from the August low as a diagonal

Here's a count that will accommodate new highs for the rally from the August lows but is less bullish than the bullish possibilties I set out in yesterday's end of day update - its a revival of a previous count that has the whole of the rally from the August low as an ending diagonal:

SPX 60 min - ending diagonal from August low:


This labelling limits the upside, if there is more to come, to 1192.52 in order for wave (v) to remain shorter than wave (iii).

Wave (iv) may have more downside to come, but it has to stay above the dotted blue line.

17:57 BST - SPX Update: possible count for corrective move from today's low - but it counts as an impulse too

The move up from today's low could count as an impulse or a correction, so no help there. Here it is as a corrective W-X-Y:

SPX 1 min - ending diagonal from 1131.87:


So, nothing to do but to continue to watch 1167.95 and 1155.71.

16:40 BST - SPX Update on the bearish counts

Once again, after a promising start, the bear counts aren't following through. With a little juggling of the labels, I can label 5 waves down from the end of a revised version of the ending diagonal from Chart 1 in yesterday's end of day update:

SPX 1 min - ending diagonal from 1131.87:


The diagonal has a truncated [C] wave within wave v, but wave v did end above wave iii, so no rules are broken.

On the count for an impulse wave up from 1131.87, the drop from 1168.68 could be re-labelled as shown in the chart below:

SPX 1 min - impulse from 1131.87:


Its not great since wave 1 is large in relation to the higher degree wave (1).

Both of these counts are invalidated above 1167.95, which would make new highs for the rally from the August low very likely. To the downside, I'm watching 1155.71 - while we remain above that, the risk of new highs remains the most likely outcome.

15:20 BST - SPX Update on the impulse from 1131.87

Here's Chart 2 from yesterday's end of day update, brought up to date with today's action. If we completed an impulse up from 1131.87 at the 1168.68 high, I've shown an alternate way to label the decline from there which puts us in wave (4) of [1] down currently. This wave would have to stay below the low labelled (1) at 1164.30 for the immediately bearish count to remain valid:

SPX 1 min - impulse from 1131.87 complete?:


The alternate labelling of a subdividing wave v of (v) will only be invalidate below 1151.41.

15:05 BST - SPX Update - Ending diagonal in Chart 1 from yesterday's end of day update confirmed as complete...but

As mentioned in yesterday's end of day update, the first reference point I was watching that might suggest an end to the rally from the August low was the black dotted line on Chart 1 in that update. Well, we've taken it out today so that rules out the possibility that the diagonal I have labelled on that chart is continuing as shown by the alternate labels:

SPX 1 min - diagonal from 1131.87:

So, if the move up from 1131.87 was a diagonal, it must now be complete. 

However, that doesn't guarantee an end to the rally from the August low. As shown in the other charts I've been posting, we may have had an impulse wave up from the 1131.87 low, in which case, the risk of further upside remains. The next level I said I'd be watching is 1151.4, which relates to the possible impulse counts shown on Chart 2 in yesterday's end of day update. If that level can get taken out, then its all eyes on 1131.87.

In the meantime, the immediately bearish argument would be strengenthed if the current move up from today's low could stay below the low I've labelled wave 1 of (3) at 1162.02 if the labelling I've shown is correct.

Monday, 11 October 2010

21:16 BST - SPX End of Day Update

On the 3 Options set out on the 60 min counts page, I'm still waiting for the end of 5 waves up from the August low  to mark the end of minor 2 (or, now less likely, (i) of [c] of 2) on Option 1, the end of wave X on Option 2 or the end of wave [i] of C (or (i) of [iii] of A) on Option 3.

We made another new high for the rally from the August low, but the question remains whether that new high is the end of the rally from that low or whether there is still more upside to come.

You can see the bigger picture into which the following charts fit by going to the 60 min counts page where you'll find the 3 Options I'm following for the move down from the April 2010 high.

The first chart is labelled as if Option 1 is playing out:

Chart 1: SPX 1 min - 5 waves up from the August low with a possible ending diagonal for wave (v): 


This diagonal could be complete at today's high.

Its also possible that today's high was only the end of wave iii of the diagonal, and we're now in wave iv. If we drop to the black dotted line in an assumed wave iv, this possibility is excluded.

The alternative to a diagonal from the 1131.87 low is that we're just seeing a straight impulse wave up from that low at 1131.87, with the low at 1151.41 being wave iv of (v). 

For this possibility, there are a number of ways to count the move up from the wave iv of (v) low at 1151.41. I've amended these from earlier to take into account today's action (this chart assumes that Option 3 is playing out):

Chart 2: SPX 1 min - 5 waves up from August low with wave v of (v) starting at 1151.41:


The main labelling assumes that  this impulse topped at 1168.88 with wave v forming an ending diagonal.

The alternate count labelled is more bullish and assumes we're still in wave v of (v) which is subdividing. The diagonal that I've labelled from the 1151.41 low would be wave [1] of v. with wave [2] now in progress. I don't really like this alternative since its likely to mean a very large wave v compared to wave i. However, until we take out 1151.41, it remains on the table.

Finally the other possible way to count this which I mentioned in an intra day update last Thursday (but not shown on the charts) is that the high at 1163.87 may have been wave i of (v) and the decline we saw from there to 1151.41 was wave ii. This would mean a potentially substantial rally coming in wave iii. If we've had a diagonal from 1151.41, that could be a leading diagonal for the first wave of wave iii. I still consider this count  to be low probability since wave ii  would only be a 38.2% retracement of the rally from 1131.87, which is perhaps rather shallow for a 2nd wave, but also because it might make wave (v) somewhat out of proportion to wave (i) in the rally from the August low. However, we'll have to see how price action develops. Only taking out the 1131.87 low would eliminate this.

So, many possibilities remain. I tend to favour the count in Chart 1 above, so there, I'm watching for the decline from the high at 1168.88 to drop to the black dotted line to exclude the possibility that 1168.88 was only wave iii in the diagonal.

After that, the key level I'm watching is 1151.41 to exclude the extending wave v shown by the alternate labels on Chart 2. Then I'll be watching 1131.87 to exclude the i-ii count from the 1131.87 low..

15:41 BST - SPX Update

With another new high for the rally from the August low, here's how its looking to me at the moment. Firstly, here's the ending diagonal shown in Chart 1 in Friday's end of day update:

SPX 1 min - ending diagonal wave (v) from the 1131.87 low:


As noted on the chart, if this count is playing out, wave v of (v) has to stay below 1176.18 in order to remain shorter than wave iii. If we're only in wave iii of the diagonal, it has to stay below 1183.41.

Here's the impulse wave up from 1131.81 shown in Chart 2 in Friday's end of day update:

SPX 1 min - impulse from 1131.87:


If this is what is going on, we may be getting an extending wave [5] of v or, we could be seeing wave v of (v) itself developing in a series of ones and twos. 

The alternate which has to be considered when ones and twos appear is a diagonal - this one would be a diagonal for wave v  of (v) with wave (1) of the diagonal at the high of 1165.99, wave (2) at the low of 1161.60 and wave (3) in progress - I've sketched in the lines of the diagonal. If wave (3) is still in progress, it has to stay below 1176.18 for the diagonal to remain valid. It may be that wave (3) ended at 1167.73 (where I have the wave (1) of [5] label currently), and today's low was wave (4). In that case, wave (5) would have to stay below 1170.61.

So, those are the possibilities I'm looking at at the moment - until we see a decisive and impulsive move down, the trend remains up. The first level I'm looking at to consider we may have seen a top is 1161.60, as noted in Friday's end of day update.

Saturday, 9 October 2010

12:47 BST - SPX Update on the cycles from the March 2000 high

Here's an update on the chart of two cycles I look at which eminate from the March 2000 high (the original post on this can be found by clicking here):

SPX Cycles from the March 2000 high:


As you can see, the turn that was expected around the 22/23 September became a turn back up as price move down into 23 September but then gapped up the following day. The gap up was the signal that all was not well with the move down that had started on 21 September since on 23 September we closed near the low of the day - the gap up was a significant failure to follow through on that bearish close. You'll note how the same thing happened at the next red cycle date on 1 October which may also have been a reversal down date. The next trading day, however, price gapped up.

We're now approaching the next turn period which falls between 12 and 14 October (the next red and grey cycle lines , respectively). Again, as emphasised previously, price action is key - bearish bars should follow through; if they don't, its a warning that should be heeded, especially since the trend remains up at this stage.

I've marked on the charts the pivots I'm watching at the moment. If the market is to make a significant turn down, these three pivots should be taken out without any difficulty. A failure to do so will suggest that further upside may be on the cards.